
- Start >
- Rivers >
- Discharge >
- Iller - Lech - Bodensee >
- Aeschach >
- Chart of year

Chart of year Aeschach / Oberreitnauer Ach
Discharge from 08.08.2022 to 07.08.2023
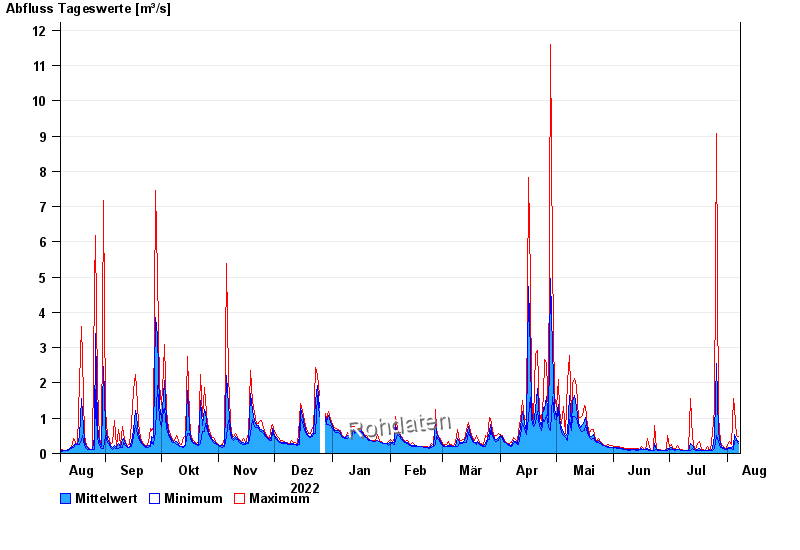
| Date | Mean value [m³/s] | Maximum [m³/s] | Minimum [m³/s] |
|---|---|---|---|
| 07.08.2023 | 0.335 | 0.486 | 0.277 |
| 06.08.2023 | 0.406 | 0.514 | 0.363 |
| 05.08.2023 | 0.552 | 1.28 | 0.341 |
| 04.08.2023 | 0.221 | 1.57 | 0.124 |
| 03.08.2023 | 0.17 | 0.258 | 0.147 |
| 02.08.2023 | 0.175 | 0.341 | 0.135 |
| 01.08.2023 | 0.146 | 0.221 | 0.113 |
© Bayerisches Landesamt für Umwelt 2024