
- Start >
- Rivers >
- Discharge >
- Iller - Lech - Bodensee >
- Aeschach >
- Chart of year

Chart of year Aeschach / Oberreitnauer Ach
Discharge from 01.01.2024 to 18.04.2024
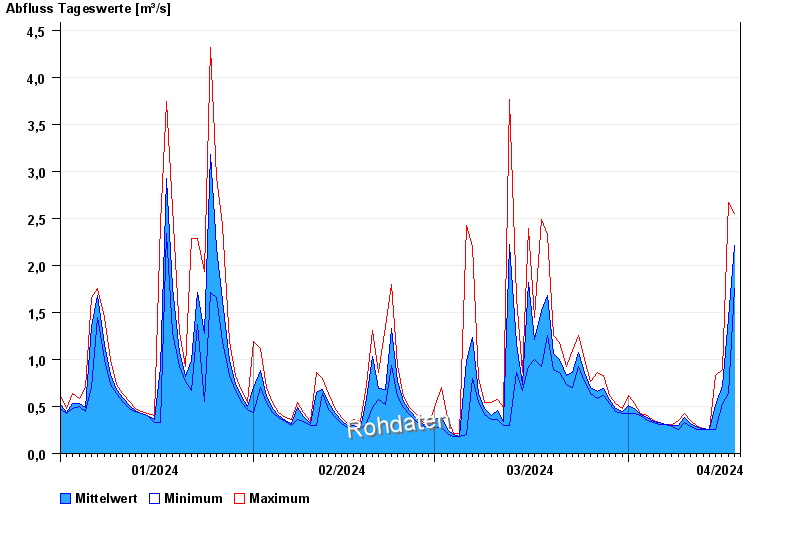
| Date | Mean value [m³/s] | Maximum [m³/s] | Minimum [m³/s] |
|---|---|---|---|
| 18.04.2024 | 2.36 | 2.55 | 2.18 |
| 17.04.2024 | 1.43 | 2.67 | 0.643 |
| 16.04.2024 | 0.725 | 0.897 | 0.53 |
| 15.04.2024 | 0.515 | 0.827 | 0.253 |
| 14.04.2024 | 0.253 | 0.253 | 0.253 |
| 13.04.2024 | 0.262 | 0.271 | 0.253 |
| 12.04.2024 | 0.277 | 0.291 | 0.253 |
© Bayerisches Landesamt für Umwelt 2024