
- Start >
- Rivers >
- Discharge >
- Iller - Lech - Bodensee >
- Aeschach >
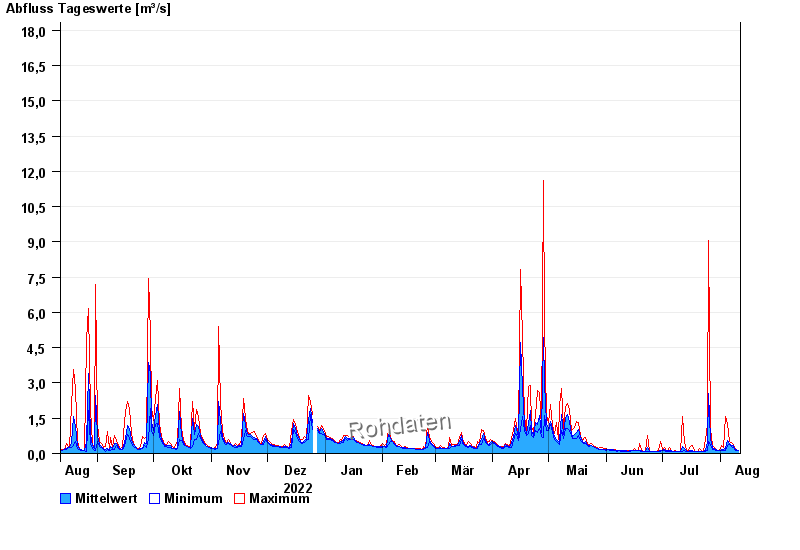
- Chart of year

Chart of year Aeschach / Oberreitnauer Ach
Discharge from 12.08.2022 to 11.08.2023
- 18.06.2010 Abfluss: 39,3 m³/s
- 11.08.2002 Abfluss: 35,7 m³/s
- 17.06.1991 Abfluss: 29,2 m³/s
- 09.08.2007 Abfluss: 27,7 m³/s
- 27.07.2010 Abfluss: 24,7 m³/s
| Date | Mean value [m³/s] | Maximum [m³/s] | Minimum [m³/s] |
|---|---|---|---|
| 11.08.2023 | 0.134 | 0.147 | 0.124 |
| 10.08.2023 | 0.166 | 0.189 | 0.147 |
| 09.08.2023 | 0.204 | 0.239 | 0.189 |
| 08.08.2023 | 0.331 | 0.387 | 0.239 |
| 07.08.2023 | 0.335 | 0.486 | 0.277 |
| 06.08.2023 | 0.406 | 0.514 | 0.363 |
| 05.08.2023 | 0.552 | 1.28 | 0.341 |
© Bayerisches Landesamt für Umwelt 2024