
- Start >
- Rivers >
- Discharge >
- Iller - Lech - Bodensee >
- Aeschach >
- Chart of total period

Chart of total period Aeschach / Oberreitnauer Ach
Discharge from 01.11.2009 to 16.04.2024
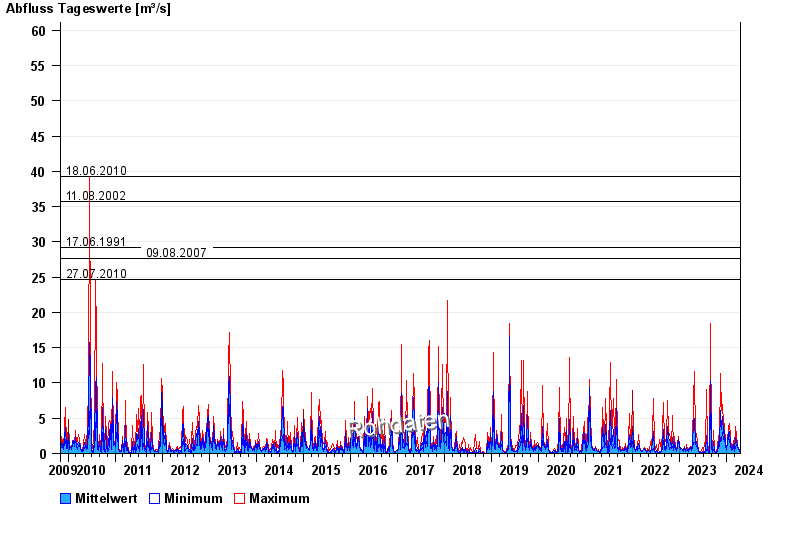
- 18.06.2010 Abfluss: 39,3 m³/s
- 11.08.2002 Abfluss: 35,7 m³/s
- 17.06.1991 Abfluss: 29,2 m³/s
- 09.08.2007 Abfluss: 27,7 m³/s
- 27.07.2010 Abfluss: 24,7 m³/s
| Date | Mean value [m³/s] | Maximum [m³/s] | Minimum [m³/s] |
|---|---|---|---|
| 16.04.2024 | 0.731 | 0.897 | 0.53 |
| 15.04.2024 | 0.515 | 0.827 | 0.253 |
| 14.04.2024 | 0.253 | 0.253 | 0.253 |
| 13.04.2024 | 0.262 | 0.271 | 0.253 |
| 12.04.2024 | 0.277 | 0.291 | 0.253 |
| 11.04.2024 | 0.315 | 0.355 | 0.291 |
| 10.04.2024 | 0.379 | 0.427 | 0.333 |
© Bayerisches Landesamt für Umwelt 2024