
- Start >
- Rivers >
- Discharge >
- Oberer Main - Elbe >
- Wirsberg >
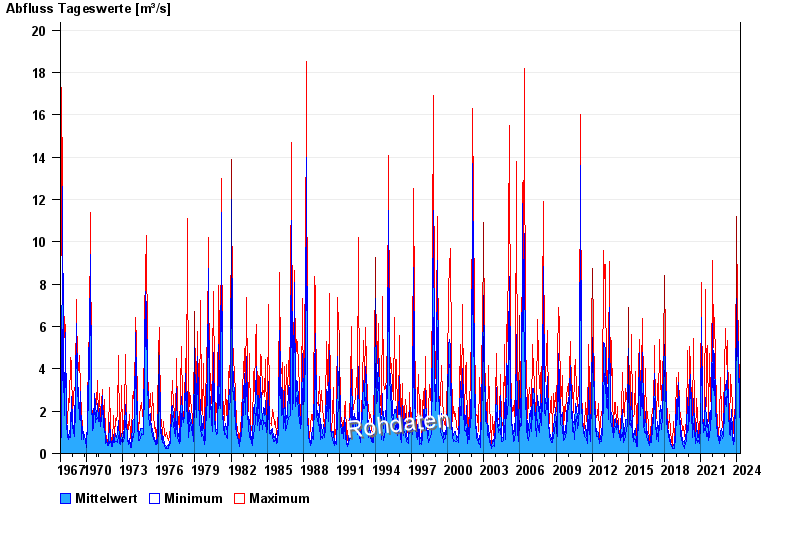
- Chart of total period

Chart of total period Wirsberg / Schorgast
Discharge from 01.11.1967 to 25.04.2024
| Date | Mean value [m³/s] | Maximum [m³/s] | Minimum [m³/s] |
|---|---|---|---|
| 25.04.2024 | 1.42 | 1.43 | 1.34 |
| 24.04.2024 | 1.38 | 1.43 | 1.34 |
| 23.04.2024 | 1.44 | 1.51 | 1.34 |
| 22.04.2024 | 1.65 | 1.97 | 1.51 |
| 21.04.2024 | 1.93 | 2.26 | 1.6 |
| 20.04.2024 | 1.94 | 2.26 | 1.6 |
| 19.04.2024 | 1.55 | 2.26 | 1.09 |
© Bayerisches Landesamt für Umwelt 2024