
- Start >
- Rivers >
- Discharge >
- Oberer Main - Elbe >
- Waldsassen >
- Chart of total period

Chart of total period Waldsassen / Wondreb
Discharge from 01.11.1966 to 17.04.2024
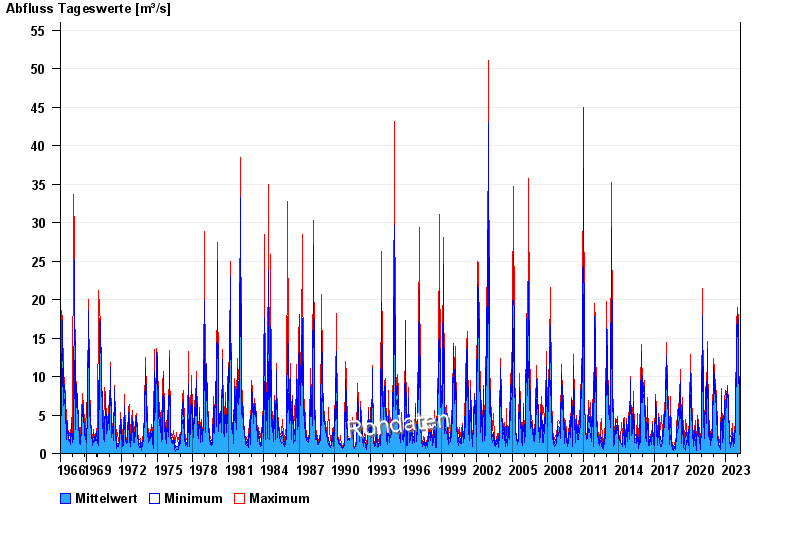
| Date | Mean value [m³/s] | Maximum [m³/s] | Minimum [m³/s] |
|---|---|---|---|
| 17.04.2024 | 1.76 | 2.11 | 1.54 |
| 16.04.2024 | 1.18 | 1.73 | 0.963 |
| 15.04.2024 | 1.02 | 1.05 | 0.963 |
| 14.04.2024 | 1.03 | 1.15 | 0.963 |
| 13.04.2024 | 1.12 | 1.35 | 0.963 |
| 12.04.2024 | 1.2 | 1.35 | 1.05 |
| 11.04.2024 | 1.49 | 1.64 | 1.25 |
© Bayerisches Landesamt für Umwelt 2024