
- Start >
- Rivers >
- Discharge >
- Oberer Main - Elbe >
- Unterzettlitz >
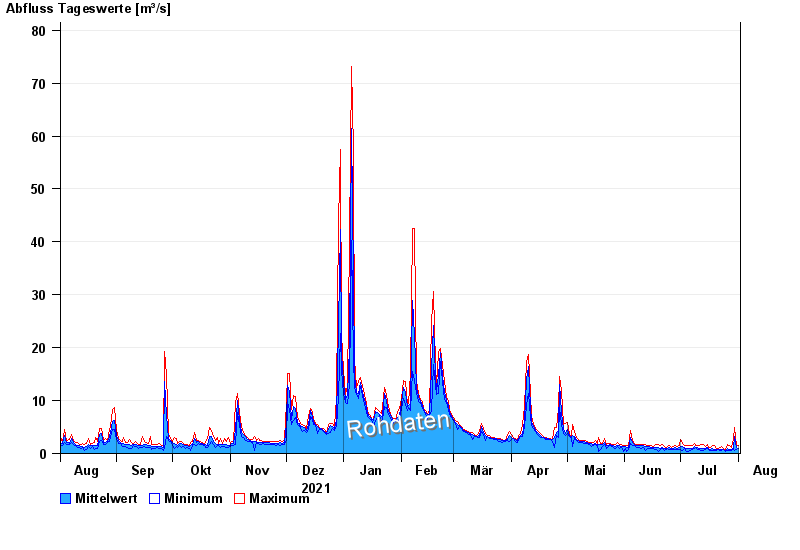
- Chart of year

Chart of year Unterzettlitz / Roter Main
Discharge from 02.08.2021 to 01.08.2022
| Date | Mean value [m³/s] | Maximum [m³/s] | Minimum [m³/s] |
|---|---|---|---|
| 01.08.2022 | 0.986 | 1.51 | 0.859 |
| 31.07.2022 | 1.2 | 1.58 | 0.714 |
| 30.07.2022 | 3.15 | 4.88 | 0.511 |
| 29.07.2022 | 0.896 | 2.87 | 0.67 |
| 28.07.2022 | 0.788 | 1.19 | 0.511 |
| 27.07.2022 | 0.811 | 1.44 | 0.511 |
| 26.07.2022 | 0.887 | 1.64 | 0.511 |
© Bayerisches Landesamt für Umwelt 2024