
- Start >
- Rivers >
- Discharge >
- Oberer Main - Elbe >
- Unterzettlitz >
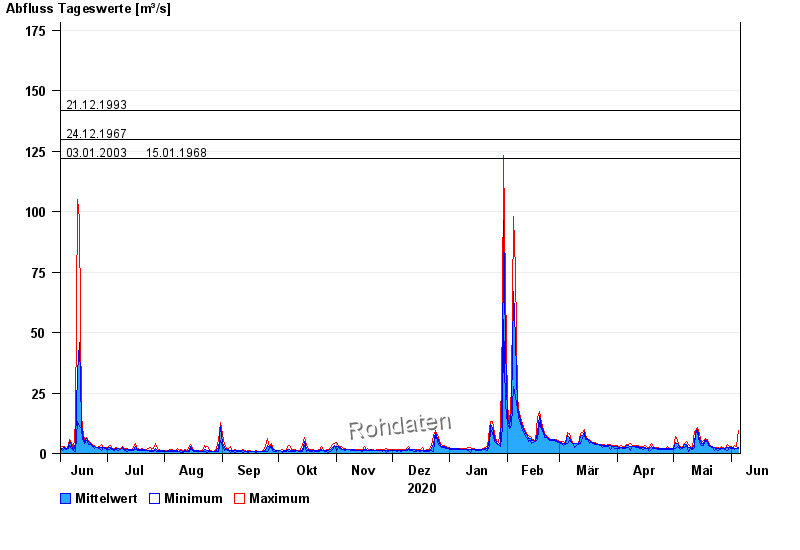
- Chart of year

Chart of year Unterzettlitz / Roter Main
Discharge from 06.06.2020 to 05.06.2021
- 26.01.1995 Abfluss: 191 m³/s
- 21.12.1993 Abfluss: 142 m³/s
- 24.12.1967 Abfluss: 130 m³/s
- 03.01.2003 Abfluss: 122 m³/s
- 15.01.1968 Abfluss: 122 m³/s
| Date | Mean value [m³/s] | Maximum [m³/s] | Minimum [m³/s] |
|---|---|---|---|
| 05.06.2021 | 2.46 | 9.52 | 1.88 |
| 04.06.2021 | 2.13 | 2.77 | 1.95 |
| 03.06.2021 | 2.21 | 3.51 | 1.6 |
| 02.06.2021 | 2.32 | 2.61 | 2.09 |
| 01.06.2021 | 2.38 | 2.77 | 2.02 |
| 31.05.2021 | 2.47 | 2.93 | 2.31 |
| 30.05.2021 | 2.64 | 3.85 | 1.05 |
© Bayerisches Landesamt für Umwelt 2024