
- Start >
- Rivers >
- Discharge >
- Oberer Main - Elbe >
- Unterzettlitz >
- Chart of year

Chart of year Unterzettlitz / Roter Main
Discharge from 01.01.2020 to 31.12.2020
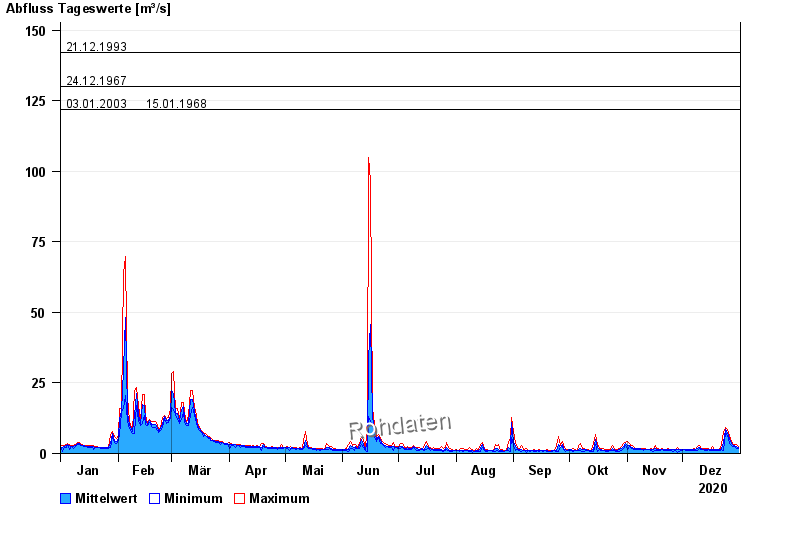
- 26.01.1995 Abfluss: 191 m³/s
- 21.12.1993 Abfluss: 142 m³/s
- 24.12.1967 Abfluss: 130 m³/s
- 03.01.2003 Abfluss: 122 m³/s
- 15.01.1968 Abfluss: 122 m³/s
| Date | Mean value [m³/s] | Maximum [m³/s] | Minimum [m³/s] |
|---|---|---|---|
| 31.12.2020 | 2.23 | 2.47 | 1.92 |
| 30.12.2020 | 2.56 | 3.09 | 1.92 |
| 29.12.2020 | 2.8 | 3.17 | 2.54 |
| 28.12.2020 | 2.92 | 3.17 | 2.39 |
| 27.12.2020 | 3.51 | 4.2 | 2.93 |
| 26.12.2020 | 5.3 | 6.51 | 3.59 |
| 25.12.2020 | 7.44 | 8.35 | 6.51 |
© Bayerisches Landesamt für Umwelt 2024