
- Start >
- Rivers >
- Discharge >
- Oberer Main - Elbe >
- Unterzettlitz >
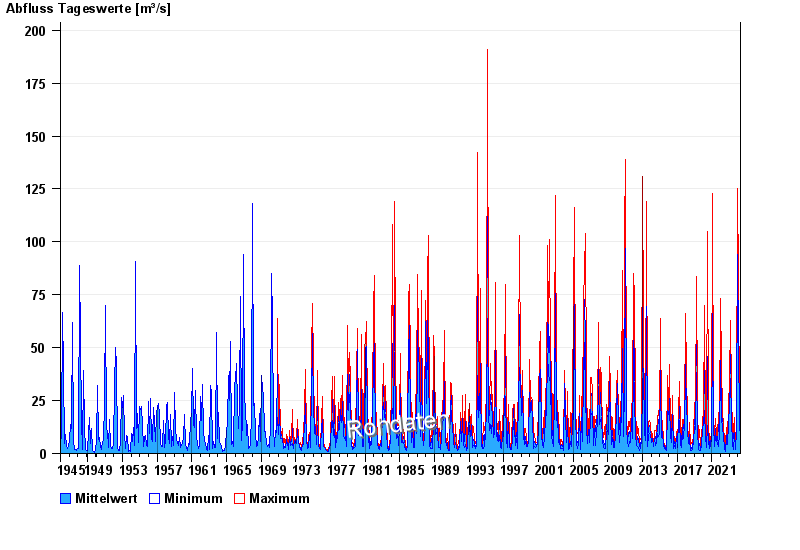
- Chart of total period

Chart of total period Unterzettlitz / Roter Main
Discharge from 01.11.1945 to 20.04.2024
| Date | Mean value [m³/s] | Maximum [m³/s] | Minimum [m³/s] |
|---|---|---|---|
| 20.04.2024 | 6.48 | 6.6 | 6.33 |
| 19.04.2024 | 4.09 | 6.33 | 3.46 |
| 18.04.2024 | 4.13 | 4.64 | 3.87 |
| 17.04.2024 | 4.57 | 5.44 | 3.71 |
| 16.04.2024 | 2.96 | 3.96 | 2.22 |
| 15.04.2024 | 2.63 | 2.74 | 2.37 |
| 14.04.2024 | 2.7 | 3.21 | 2.51 |
© Bayerisches Landesamt für Umwelt 2024