
- Start >
- Rivers >
- Discharge >
- Oberer Main - Elbe >
- Unterzettlitz >
- Chart of total period

Chart of total period Unterzettlitz / Roter Main
Discharge from 01.11.1945 to 25.04.2024
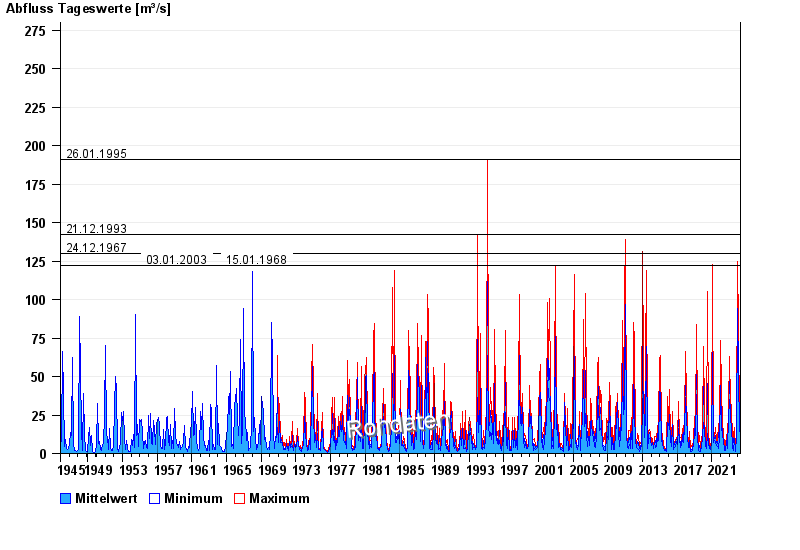
- 26.01.1995 Abfluss: 191 m³/s
- 21.12.1993 Abfluss: 142 m³/s
- 24.12.1967 Abfluss: 130 m³/s
- 03.01.2003 Abfluss: 122 m³/s
- 15.01.1968 Abfluss: 122 m³/s
| Date | Mean value [m³/s] | Maximum [m³/s] | Minimum [m³/s] |
|---|---|---|---|
| 25.04.2024 | 6.27 | 6.87 | 5.88 |
| 24.04.2024 | 7.08 | 7.61 | 6.33 |
| 23.04.2024 | 10 | 12.6 | 7.61 |
| 22.04.2024 | 17.7 | 19.9 | 12.7 |
| 21.04.2024 | 11.5 | 18 | 9.19 |
| 20.04.2024 | 9.05 | 10.1 | 6.33 |
| 19.04.2024 | 4.09 | 6.33 | 3.46 |
© Bayerisches Landesamt für Umwelt 2024