
- Start >
- Rivers >
- Discharge >
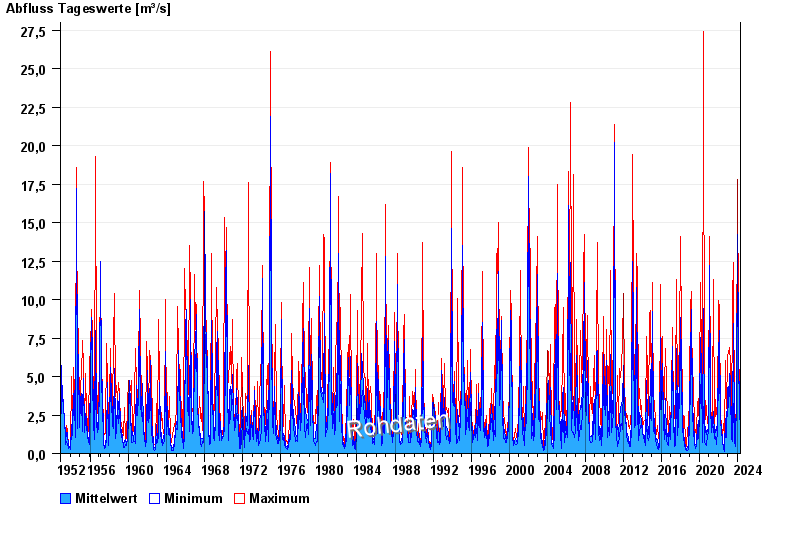
- Oberer Main - Elbe >
- Untersteinach >
- Chart of total period

Chart of total period Untersteinach / Warme Steinach
Discharge from 01.11.1952 to 24.04.2024
| Date | Mean value [m³/s] | Maximum [m³/s] | Minimum [m³/s] |
|---|---|---|---|
| 24.04.2024 | 1.79 | 1.79 | 1.69 |
| 23.04.2024 | 1.84 | 1.98 | 1.69 |
| 22.04.2024 | 2.15 | 2.63 | 1.98 |
| 21.04.2024 | 2.83 | 4.3 | 2.09 |
| 20.04.2024 | 2.5 | 3.11 | 2.09 |
| 19.04.2024 | 1.29 | 2.09 | 0.971 |
| 18.04.2024 | 1.04 | 1.11 | 0.971 |
© Bayerisches Landesamt für Umwelt 2024