
- Start >
- Rivers >
- Discharge >
- Oberer Main - Elbe >
- Untersteinach >
- Chart of total period

Chart of total period Untersteinach / Untere Steinach
Discharge from 01.11.1956 to 19.04.2024
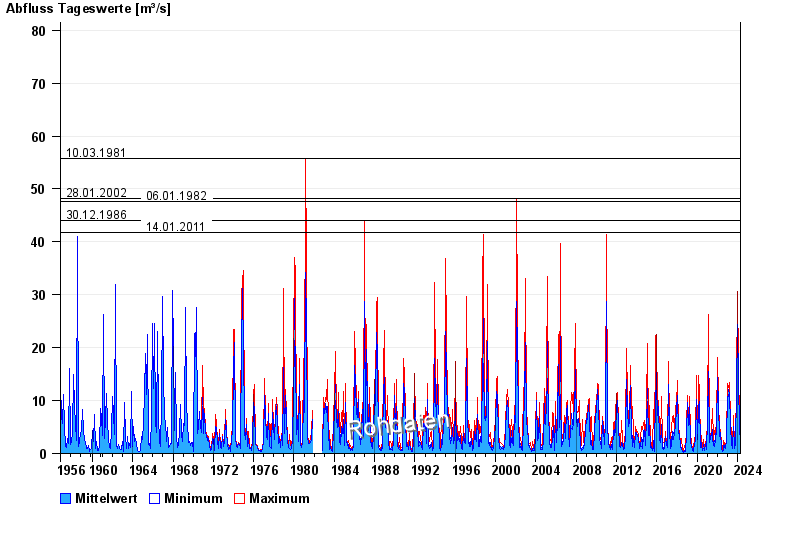
- 10.03.1981 Abfluss: 55,8 m³/s
- 28.01.2002 Abfluss: 48,2 m³/s
- 06.01.1982 Abfluss: 47,7 m³/s
- 30.12.1986 Abfluss: 44 m³/s
- 14.01.2011 Abfluss: 41,7 m³/s
| Date | Mean value [m³/s] | Maximum [m³/s] | Minimum [m³/s] |
|---|---|---|---|
| 19.04.2024 | 1.54 | 2.75 | 1.1 |
| 18.04.2024 | 1.18 | 1.23 | 1.1 |
| 17.04.2024 | 1.26 | 1.44 | 1.16 |
| 16.04.2024 | 1.24 | 1.44 | 1.1 |
| 15.04.2024 | 1.13 | 1.23 | 1.1 |
| 14.04.2024 | 1.16 | 1.23 | 1.1 |
| 13.04.2024 | 1.2 | 1.23 | 1.16 |
© Bayerisches Landesamt für Umwelt 2024