
- Start >
- Rivers >
- Discharge >
- Oberer Main - Elbe >
- Untersteinach >
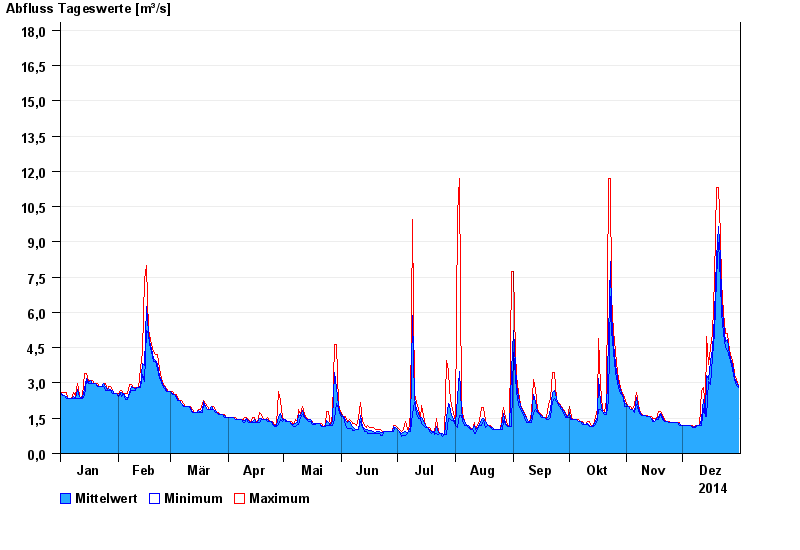
- Chart of year

Chart of year Untersteinach / Schorgast
Discharge from 01.01.2014 to 31.12.2014
note
Schlechte Netzanbindung
- 28.05.2006 Abfluss: 81,4 m³/s
- 28.01.2002 Abfluss: 76,1 m³/s
- 06.01.1982 Abfluss: 68,6 m³/s
- 27.02.2002 Abfluss: 67 m³/s
- 30.12.1986 Abfluss: 66,9 m³/s
| Date | Mean value [m³/s] | Maximum [m³/s] | Minimum [m³/s] |
|---|---|---|---|
| 31.12.2014 | 2.83 | 2.91 | 2.8 |
| 30.12.2014 | 3.02 | 3.13 | 2.91 |
| 29.12.2014 | 3.24 | 3.36 | 3.13 |
| 28.12.2014 | 3.61 | 3.79 | 3.36 |
| 27.12.2014 | 3.9 | 4.08 | 3.79 |
| 26.12.2014 | 4.23 | 4.37 | 4.08 |
| 25.12.2014 | 4.83 | 5.1 | 4.37 |
© Bayerisches Landesamt für Umwelt 2024