
- Start >
- Rivers >
- Discharge >
- Oberer Main - Elbe >
- Untersteinach >
- Chart of year

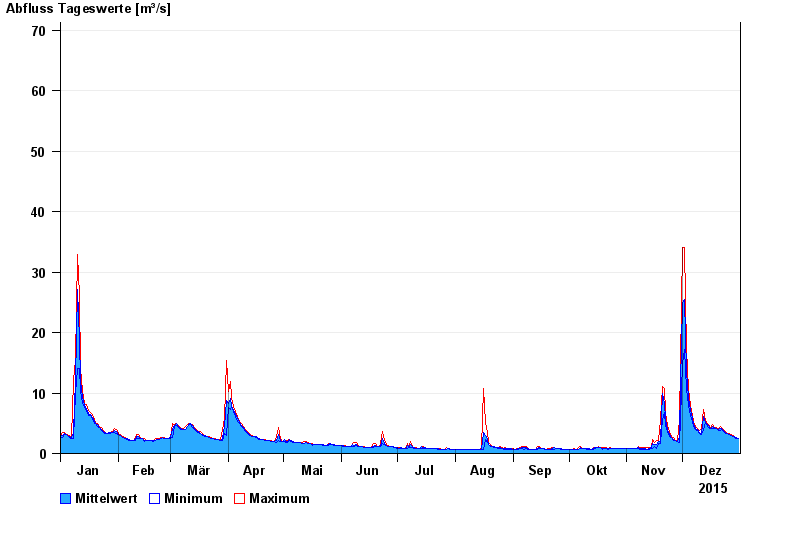
Chart of year Untersteinach / Schorgast
Discharge from 01.01.2015 to 31.12.2015
 Für diesen Pegel sind keine Jährlichkeiten hinterlegt.
note
Schlechte Netzanbindung
| Date | Mean value [m³/s] | Maximum [m³/s] | Minimum [m³/s] |
|---|---|---|---|
| 31.12.2015 | 2.56 | 2.56 | 2.56 |
| 30.12.2015 | 2.6 | 2.69 | 2.43 |
| 29.12.2015 | 2.73 | 2.83 | 2.69 |
| 28.12.2015 | 2.86 | 2.96 | 2.82 |
| 27.12.2015 | 3.03 | 3.1 | 2.96 |
| 26.12.2015 | 3.18 | 3.38 | 3.1 |
| 25.12.2015 | 3.38 | 3.38 | 3.38 |
© Bayerisches Landesamt für Umwelt 2024