
- Start >
- Rivers >
- Discharge >
- Oberer Main - Elbe >
- Untersteinach >
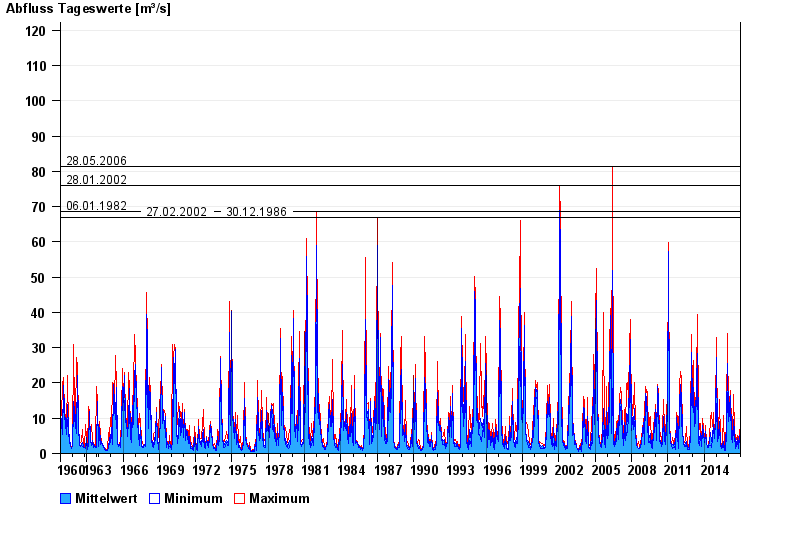
- Chart of total period

Chart of total period Untersteinach / Schorgast
Discharge from 01.11.1960 to 31.12.2016
note
Schlechte Netzanbindung
- 28.05.2006 Abfluss: 81,4 m³/s
- 28.01.2002 Abfluss: 76,1 m³/s
- 06.01.1982 Abfluss: 68,6 m³/s
- 27.02.2002 Abfluss: 67 m³/s
- 30.12.1986 Abfluss: 66,9 m³/s
| Date | Mean value [m³/s] | Maximum [m³/s] | Minimum [m³/s] |
|---|---|---|---|
| 31.12.2016 | 1.93 | 2.08 | 1.84 |
| 30.12.2016 | 2.11 | 2.2 | 2.08 |
| 29.12.2016 | 2.26 | 2.33 | 2.2 |
| 28.12.2016 | 2.26 | 2.33 | 2.08 |
| 27.12.2016 | 2.09 | 2.2 | 1.84 |
| 26.12.2016 | 2.1 | 2.2 | 1.84 |
| 25.12.2016 | 1.61 | 1.84 | 1.51 |
© Bayerisches Landesamt für Umwelt 2024