
- Start >
- Rivers >
- Discharge >
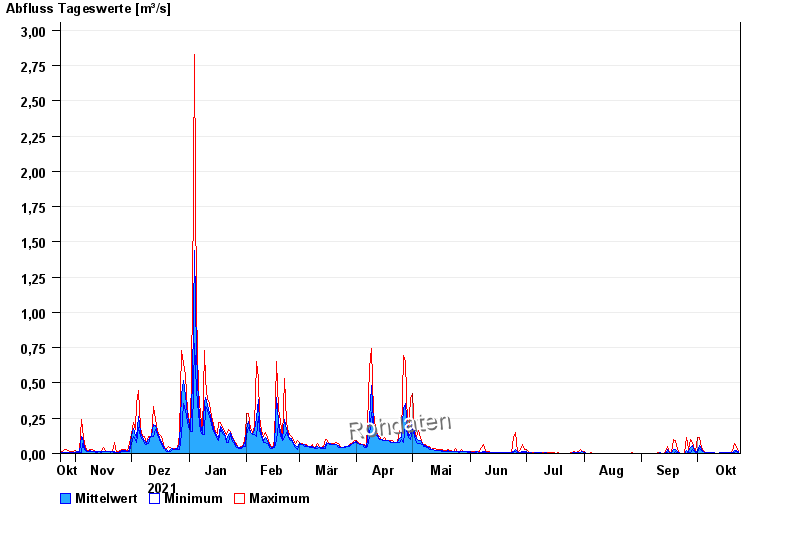
- Oberer Main - Elbe >
- Untermerzbach >
- Chart of year

Chart of year Untermerzbach / Merzbach
Discharge from 24.10.2021 to 23.10.2022
| Date | Mean value [m³/s] | Maximum [m³/s] | Minimum [m³/s] |
|---|---|---|---|
| 23.10.2022 | 0.011 | 0.016 | 0.009 |
| 22.10.2022 | 0.022 | 0.04 | 0.016 |
| 21.10.2022 | 0.022 | 0.073 | 0.004 |
| 20.10.2022 | 0.005 | 0.04 | 0.004 |
| 19.10.2022 | 0.004 | 0.004 | 0.004 |
| 18.10.2022 | 0.004 | 0.004 | 0.004 |
| 17.10.2022 | 0.005 | 0.006 | 0.004 |
© Bayerisches Landesamt für Umwelt 2024