
- Start >
- Rivers >
- Discharge >
- Oberer Main - Elbe >
- Unterleinleiter >
- Chart of year

Chart of year Unterleinleiter / Leinleiterbach
Discharge from 01.01.2024 to 19.04.2024
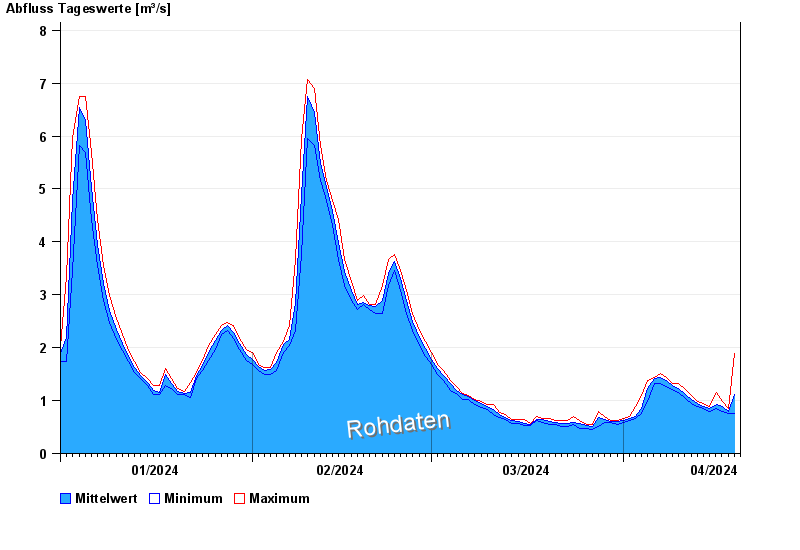
| Date | Mean value [m³/s] | Maximum [m³/s] | Minimum [m³/s] |
|---|---|---|---|
| 19.04.2024 | 0.756 | 0.793 | 0.75 |
| 18.04.2024 | 0.8 | 0.844 | 0.75 |
| 17.04.2024 | 0.892 | 0.989 | 0.793 |
| 16.04.2024 | 0.932 | 1.15 | 0.844 |
| 15.04.2024 | 0.842 | 0.89 | 0.793 |
| 14.04.2024 | 0.882 | 0.942 | 0.844 |
| 13.04.2024 | 0.944 | 0.989 | 0.89 |
© Bayerisches Landesamt für Umwelt 2024