
- Start >
- Rivers >
- Discharge >
- Oberer Main - Elbe >
- Unterleinleiter >
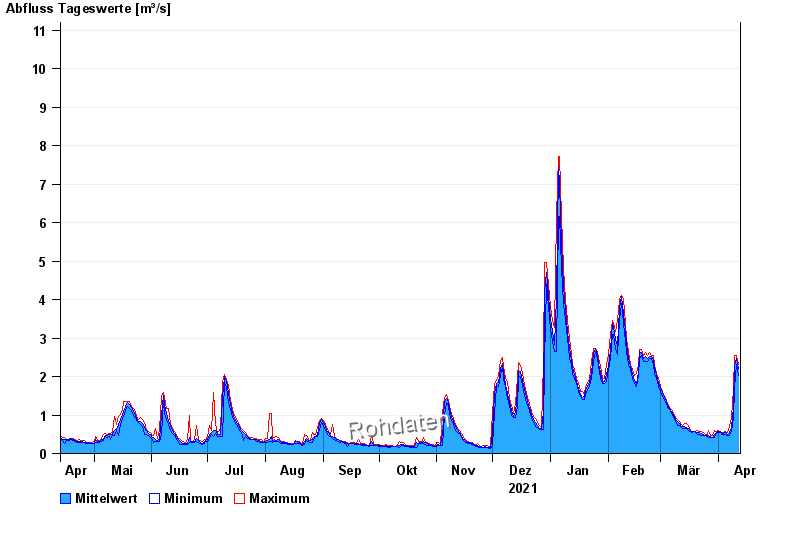
- Chart of year

Chart of year Unterleinleiter / Leinleiterbach
Discharge from 13.04.2021 to 12.04.2022
- 23.02.1970 Abfluss: 31 m³/s
- 26.01.1995 Abfluss: 30,7 m³/s
- 06.01.1982 Abfluss: 23,5 m³/s
- 26.03.1988 Abfluss: 21 m³/s
- 14.01.2011 Abfluss: 19,1 m³/s
| Date | Mean value [m³/s] | Maximum [m³/s] | Minimum [m³/s] |
|---|---|---|---|
| 12.04.2022 | 2.21 | 2.32 | 2.02 |
| 11.04.2022 | 2.47 | 2.55 | 2.32 |
| 10.04.2022 | 2.29 | 2.55 | 1.68 |
| 09.04.2022 | 1.23 | 1.68 | 0.923 |
| 08.04.2022 | 0.683 | 0.923 | 0.57 |
| 07.04.2022 | 0.533 | 0.691 | 0.465 |
| 06.04.2022 | 0.495 | 0.533 | 0.465 |
© Bayerisches Landesamt für Umwelt 2024