
- Start >
- Rivers >
- Discharge >
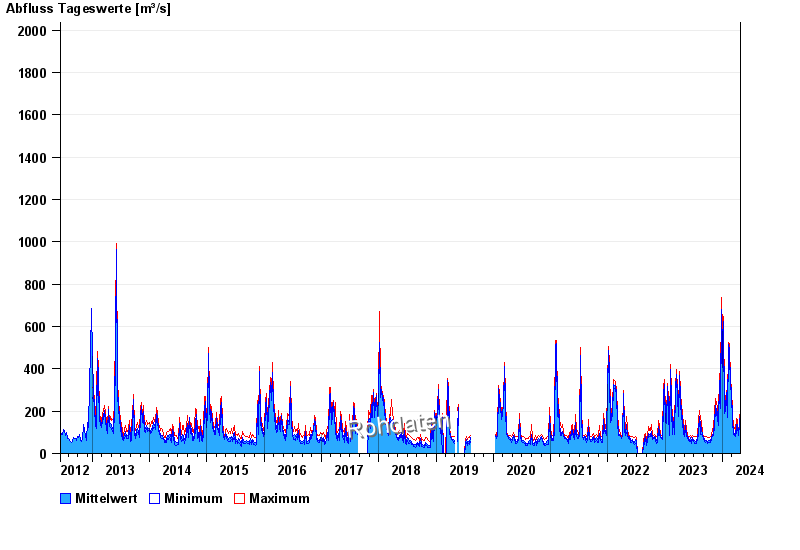
- Oberer Main - Elbe >
- Trunstadt Q >
- Chart of total period

Chart of total period Trunstadt Q / Main
Discharge from 12.06.2012 to 24.04.2024
 Für diesen Pegel sind keine Jährlichkeiten hinterlegt.
note
STÖRUNG BEHOBEN - Ultraschallanlage; kein Hochwasserpegel
| Date | Mean value [m³/s] | Maximum [m³/s] | Minimum [m³/s] |
|---|---|---|---|
| 24.04.2024 | 156 | 157 | 154 |
| 23.04.2024 | 164 | 180 | 139 |
| 22.04.2024 | 181 | 209 | 161 |
| 21.04.2024 | 153 | 161 | 134 |
| 20.04.2024 | 118 | 137 | 85 |
| 19.04.2024 | 83.6 | 85.2 | 81.8 |
| 18.04.2024 | 85 | 96.2 | 81.6 |
© Bayerisches Landesamt für Umwelt 2024