
- Start >
- Rivers >
- Discharge >
- Oberer Main - Elbe >
- Trunstadt >
- Chart of year

Chart of year Trunstadt / Main
Discharge from 29.02.2020 to 28.02.2021
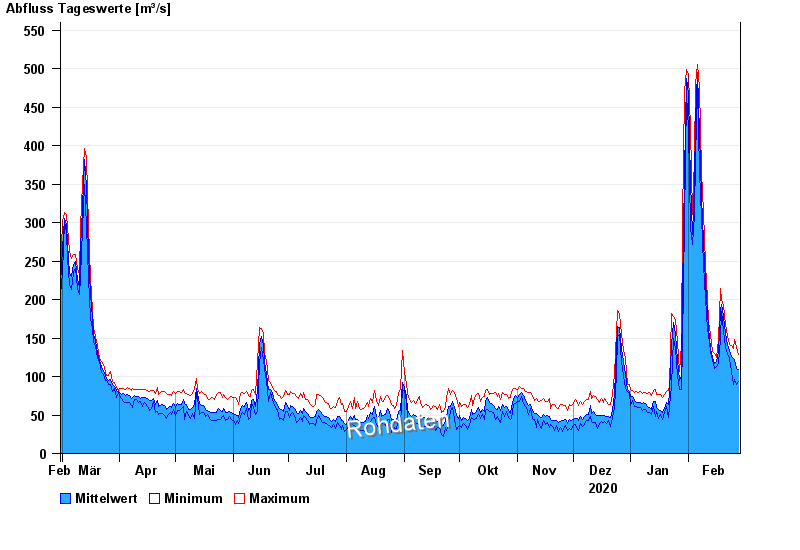
| Date | Mean value [m³/s] | Maximum [m³/s] | Minimum [m³/s] |
|---|---|---|---|
| 28.02.2021 | 109 | 128 | 93.6 |
| 27.02.2021 | 110 | 138 | 90.1 |
| 26.02.2021 | 121 | 148 | 95.5 |
| 25.02.2021 | 124 | 136 | 90.2 |
| 24.02.2021 | 126 | 140 | 107 |
| 23.02.2021 | 134 | 142 | 123 |
| 22.02.2021 | 141 | 152 | 130 |
© Bayerisches Landesamt für Umwelt 2024