
- Start >
- Rivers >
- Discharge >
- Oberer Main - Elbe >
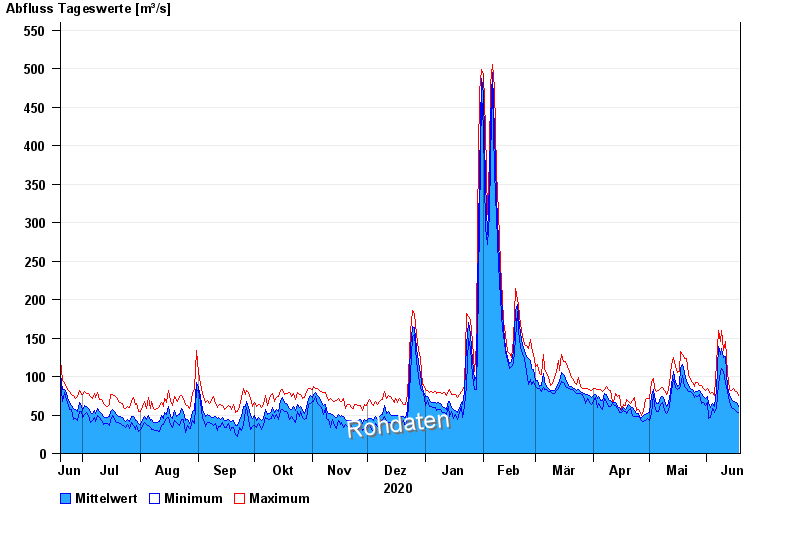
- Trunstadt >
- Chart of year

Chart of year Trunstadt / Main
Discharge from 19.06.2020 to 18.06.2021
| Date | Mean value [m³/s] | Maximum [m³/s] | Minimum [m³/s] |
|---|---|---|---|
| 18.06.2021 | 60.5 | 75.9 | 52.7 |
| 17.06.2021 | 65.9 | 80 | 55.1 |
| 16.06.2021 | 67 | 82.3 | 57.7 |
| 15.06.2021 | 67.9 | 84.4 | 59 |
| 14.06.2021 | 70.6 | 82.1 | 59.8 |
| 13.06.2021 | 77.3 | 83.4 | 68.1 |
| 12.06.2021 | 85.4 | 105 | 80.1 |
© Bayerisches Landesamt für Umwelt 2024