
- Start >
- Rivers >
- Discharge >
- Oberer Main - Elbe >
- Trebgast >
- Chart of year

Chart of year Trebgast / Trebgast
Discharge from 01.01.2024 to 25.04.2024
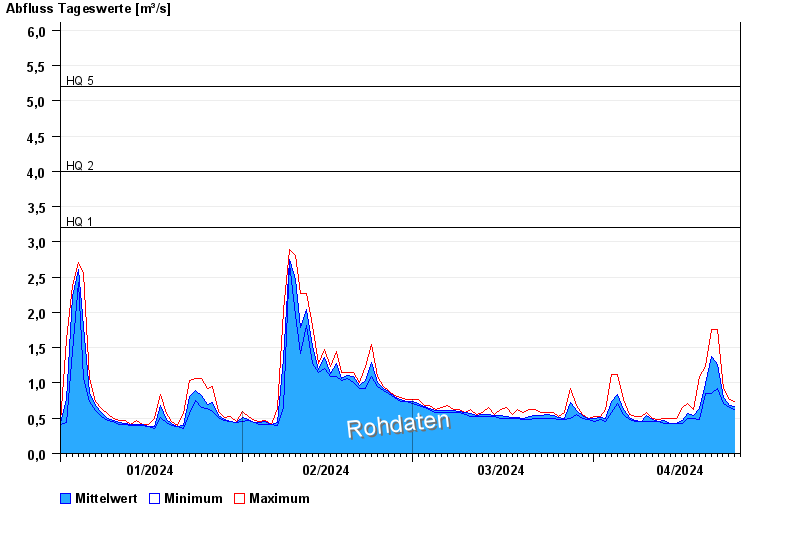
- HQ1 3,2 m³/s
- HQ2 4 m³/s
- HQ5 5,2 m³/s
- HQ10 6,2 m³/s
- HQ20 7,1 m³/s
- HQ50 8,4 m³/s
- HQ100 10 m³/s
| Date | Mean value [m³/s] | Maximum [m³/s] | Minimum [m³/s] |
|---|---|---|---|
| 25.04.2024 | 0.625 | 0.647 | 0.618 |
| 24.04.2024 | 0.683 | 0.767 | 0.647 |
| 23.04.2024 | 0.798 | 0.917 | 0.707 |
| 22.04.2024 | 1.26 | 1.76 | 0.917 |
| 21.04.2024 | 1.37 | 1.76 | 0.857 |
| 20.04.2024 | 0.994 | 1.24 | 0.857 |
| 19.04.2024 | 0.639 | 1.09 | 0.477 |
© Bayerisches Landesamt für Umwelt 2024