
- Start >
- Rivers >
- Discharge >
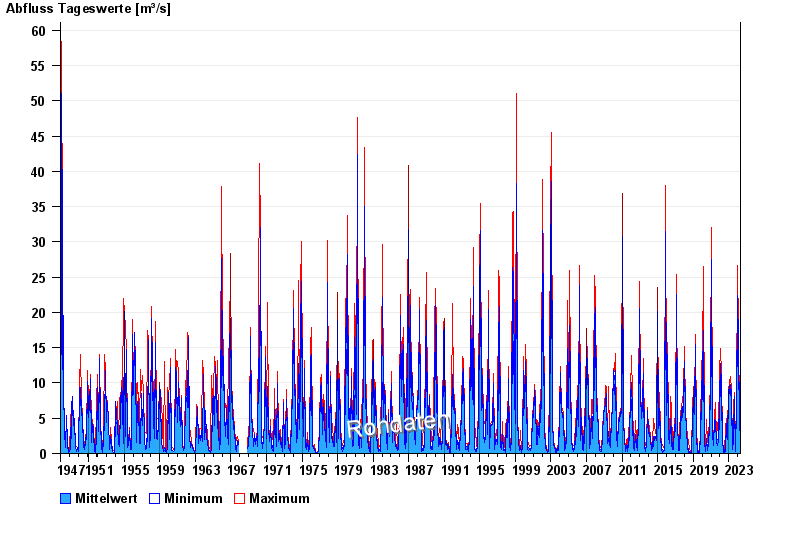
- Oberer Main - Elbe >
- Steinberg >
- Chart of total period

Chart of total period Steinberg / Kronach
Discharge from 01.11.1947 to 25.04.2024
| Date | Mean value [m³/s] | Maximum [m³/s] | Minimum [m³/s] |
|---|---|---|---|
| 25.04.2024 | 2.28 | 2.38 | 2.19 |
| 24.04.2024 | 2.15 | 2.25 | 2.07 |
| 23.04.2024 | 2.29 | 2.32 | 2.19 |
| 22.04.2024 | 2.06 | 2.32 | 1.76 |
| 21.04.2024 | 1.68 | 1.88 | 1.58 |
| 20.04.2024 | 1.46 | 1.58 | 1.33 |
| 19.04.2024 | 1.06 | 1.58 | 0.767 |
© Bayerisches Landesamt für Umwelt 2024