
- Start >
- Rivers >
- Discharge >
- Oberer Main - Elbe >
- Schönbrunn >
- Chart of total period

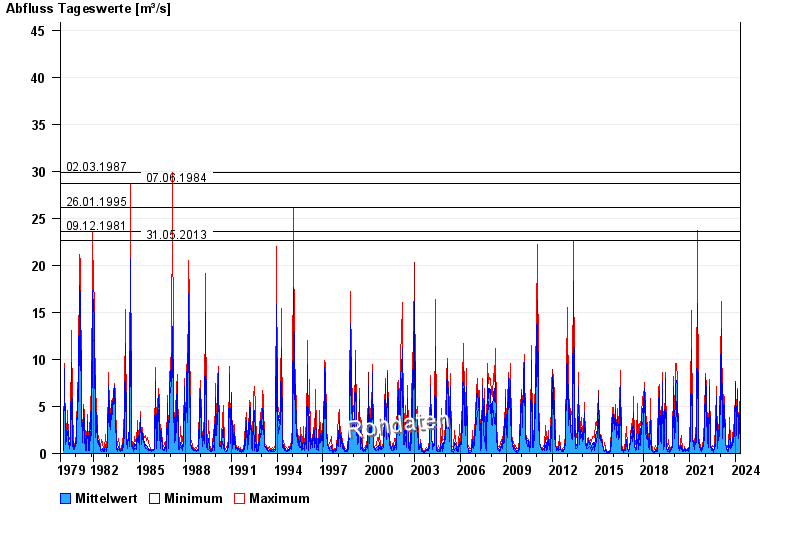
Chart of total period Schönbrunn / Rauhe Ebrach
Discharge from 01.11.1979 to 24.04.2024
note
Beeinflussung des Abflusses aufgrund Hindernisse im Unterlauf
- 02.03.1987 Abfluss: 29,9 m³/s
- 07.06.1984 Abfluss: 28,7 m³/s
- 26.01.1995 Abfluss: 26,1 m³/s
- 09.12.1981 Abfluss: 23,6 m³/s
- 31.05.2013 Abfluss: 22,6 m³/s
| Date | Mean value [m³/s] | Maximum [m³/s] | Minimum [m³/s] |
|---|---|---|---|
| 24.04.2024 | 2.03 | 2.03 | 2.03 |
| 23.04.2024 | 2.47 | 3.15 | 2.03 |
| 22.04.2024 | 4.64 | 5.8 | 3.2 |
| 21.04.2024 | 3.09 | 5.47 | 1.4 |
| 20.04.2024 | 2.18 | 3.06 | 1.44 |
| 19.04.2024 | 0.954 | 2.59 | 0.546 |
| 18.04.2024 | 0.566 | 0.666 | 0.487 |
© Bayerisches Landesamt für Umwelt 2024