
- Start >
- Rivers >
- Discharge >
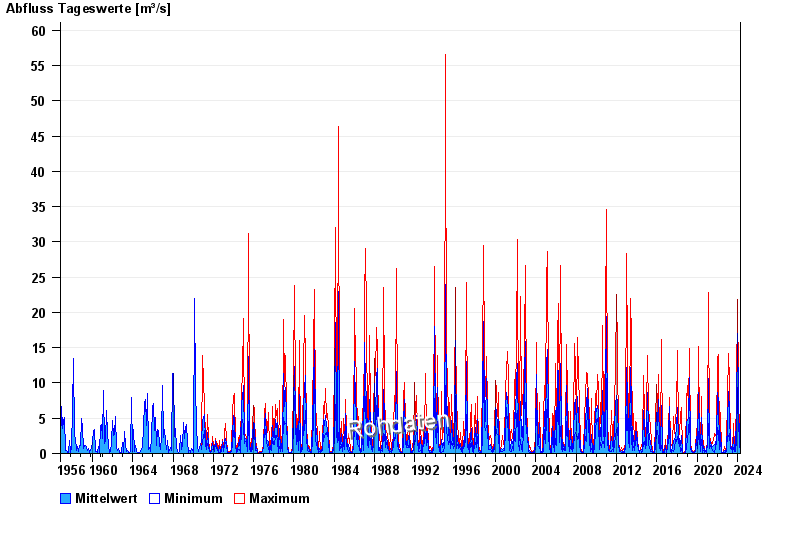
- Oberer Main - Elbe >
- Schlehenmühle >
- Chart of total period

Chart of total period Schlehenmühle / Roter Main
Discharge from 01.11.1956 to 18.04.2024
| Date | Mean value [m³/s] | Maximum [m³/s] | Minimum [m³/s] |
|---|---|---|---|
| 18.04.2024 | 0.324 | 0.371 | 0.263 |
| 17.04.2024 | 0.353 | 0.457 | 0.263 |
| 16.04.2024 | 0.224 | 0.296 | 0.203 |
| 15.04.2024 | 0.217 | 0.263 | 0.176 |
| 14.04.2024 | 0.207 | 0.232 | 0.203 |
| 13.04.2024 | 0.232 | 0.232 | 0.232 |
| 12.04.2024 | 0.232 | 0.232 | 0.232 |
© Bayerisches Landesamt für Umwelt 2024