
- Start >
- Rivers >
- Discharge >
- Oberer Main - Elbe >
- Rieblich >
- Chart of year

Chart of year Rieblich / Rodach
Discharge from 01.01.2018 to 31.12.2018
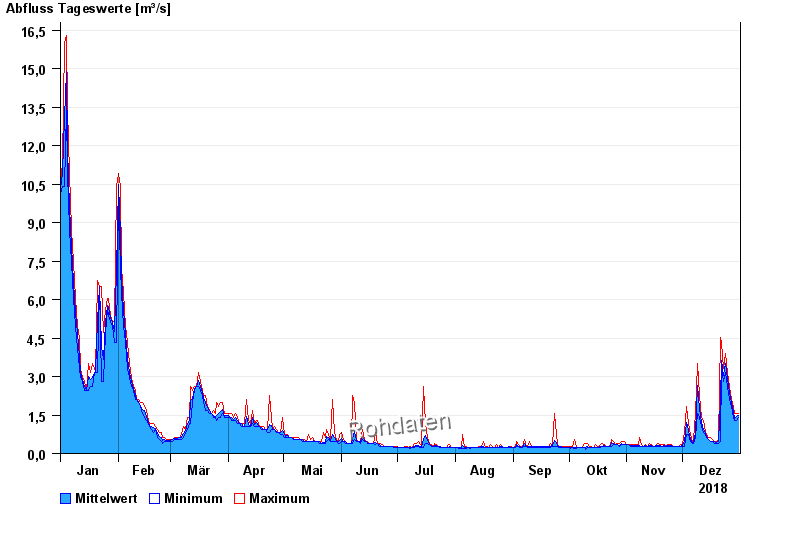
| Date | Mean value [m³/s] | Maximum [m³/s] | Minimum [m³/s] |
|---|---|---|---|
| 31.12.2018 | 1.5 | 1.55 | 1.41 |
| 30.12.2018 | 1.44 | 1.55 | 1.29 |
| 29.12.2018 | 1.38 | 1.55 | 1.29 |
| 28.12.2018 | 1.65 | 1.83 | 1.41 |
| 27.12.2018 | 1.97 | 2.12 | 1.83 |
| 26.12.2018 | 2.39 | 2.61 | 2.12 |
| 25.12.2018 | 2.92 | 3.15 | 2.61 |
© Bayerisches Landesamt für Umwelt 2024