
- Start >
- Rivers >
- Discharge >
- Oberer Main - Elbe >
- Pfarrweisach >
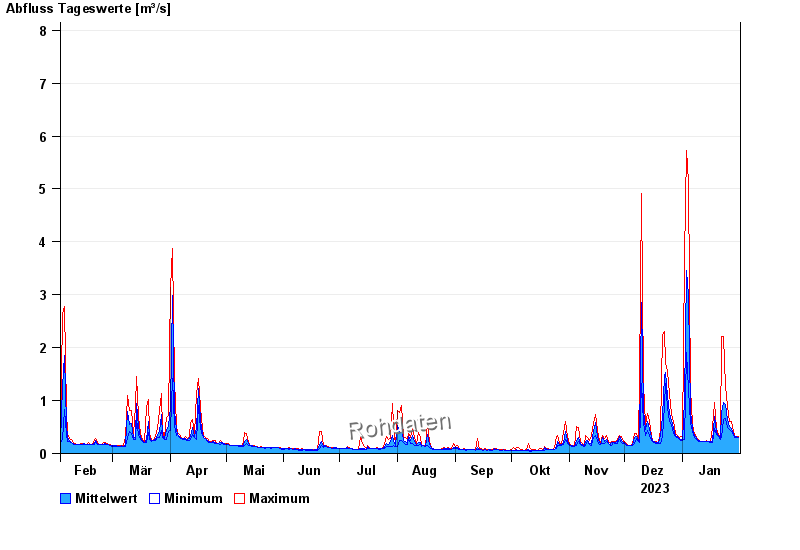
- Chart of year

Chart of year Pfarrweisach / Weisach
Discharge from 01.02.2023 to 31.01.2024
- 23.01.1995 Abfluss: 28,8 m³/s
- 08.12.1981 Abfluss: 17,6 m³/s
- 12.04.2008 Abfluss: 16,8 m³/s
- 05.01.1982 Abfluss: 16,5 m³/s
- 01.04.1988 Abfluss: 15,8 m³/s
| Date | Mean value [m³/s] | Maximum [m³/s] | Minimum [m³/s] |
|---|---|---|---|
| 31.01.2024 | 0.308 | 0.327 | 0.294 |
| 30.01.2024 | 0.316 | 0.327 | 0.311 |
| 29.01.2024 | 0.326 | 0.344 | 0.311 |
| 28.01.2024 | 0.37 | 0.416 | 0.344 |
| 27.01.2024 | 0.469 | 0.6 | 0.416 |
| 26.01.2024 | 0.51 | 0.6 | 0.454 |
| 25.01.2024 | 0.638 | 0.895 | 0.494 |
© Bayerisches Landesamt für Umwelt 2024