
- Start >
- Rivers >
- Discharge >
- Oberer Main - Elbe >
- Pfarrweisach >
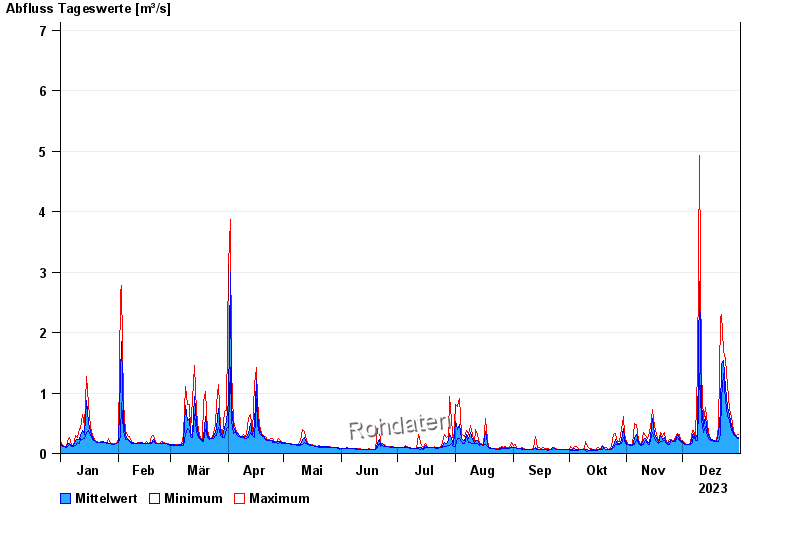
- Chart of year

Chart of year Pfarrweisach / Weisach
Discharge from 01.01.2023 to 31.12.2023
- 23.01.1995 Abfluss: 28,8 m³/s
- 08.12.1981 Abfluss: 17,6 m³/s
- 12.04.2008 Abfluss: 16,8 m³/s
- 05.01.1982 Abfluss: 16,5 m³/s
- 01.04.1988 Abfluss: 15,8 m³/s
| Date | Mean value [m³/s] | Maximum [m³/s] | Minimum [m³/s] |
|---|---|---|---|
| 31.12.2023 | 0.267 | 0.314 | 0.25 |
| 30.12.2023 | 0.285 | 0.297 | 0.265 |
| 29.12.2023 | 0.315 | 0.331 | 0.297 |
| 28.12.2023 | 0.347 | 0.385 | 0.314 |
| 27.12.2023 | 0.464 | 0.61 | 0.385 |
| 26.12.2023 | 0.624 | 0.731 | 0.544 |
| 25.12.2023 | 0.762 | 1.13 | 0.61 |
© Bayerisches Landesamt für Umwelt 2024