
- Start >
- Rivers >
- Discharge >
- Oberer Main - Elbe >
- Oberlauter >
- Chart of year

Chart of year Oberlauter / Lauterbach
Discharge from 25.07.2023 to 24.07.2024
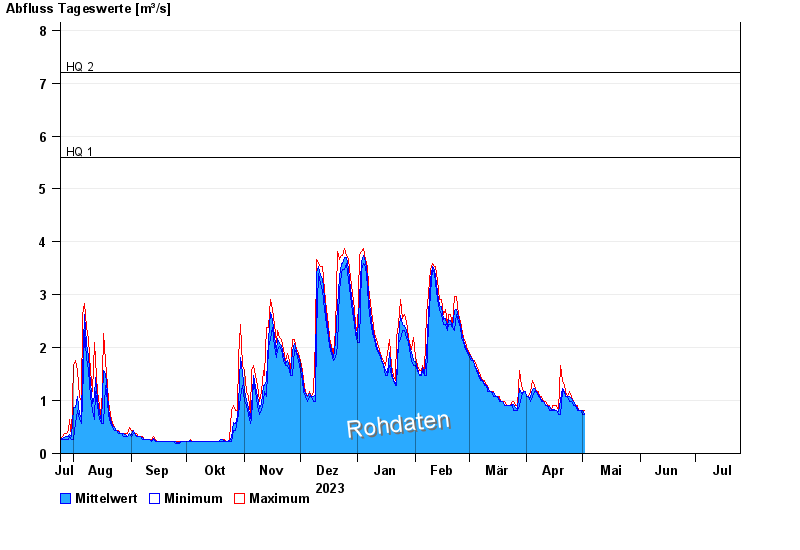
- HQ1 5,6 m³/s
- HQ2 7,2 m³/s
- HQ5 9,4 m³/s
- HQ10 11,3 m³/s
- HQ20 13,2 m³/s
- HQ50 16,1 m³/s
- HQ100 18,5 m³/s
| Date | Mean value [m³/s] | Maximum [m³/s] | Minimum [m³/s] |
|---|---|---|---|
| 19.04.2024 | 0.857 | 1.57 | 0.732 |
| 18.04.2024 | 0.799 | 0.816 | 0.732 |
| 17.04.2024 | 0.818 | 0.902 | 0.816 |
| 16.04.2024 | 0.839 | 0.902 | 0.816 |
| 15.04.2024 | 0.824 | 0.902 | 0.816 |
| 14.04.2024 | 0.816 | 0.816 | 0.816 |
| 13.04.2024 | 0.891 | 0.902 | 0.816 |
© Bayerisches Landesamt für Umwelt 2024