
- Start >
- Rivers >
- Discharge >
- Oberer Main - Elbe >
- Oberlauter >
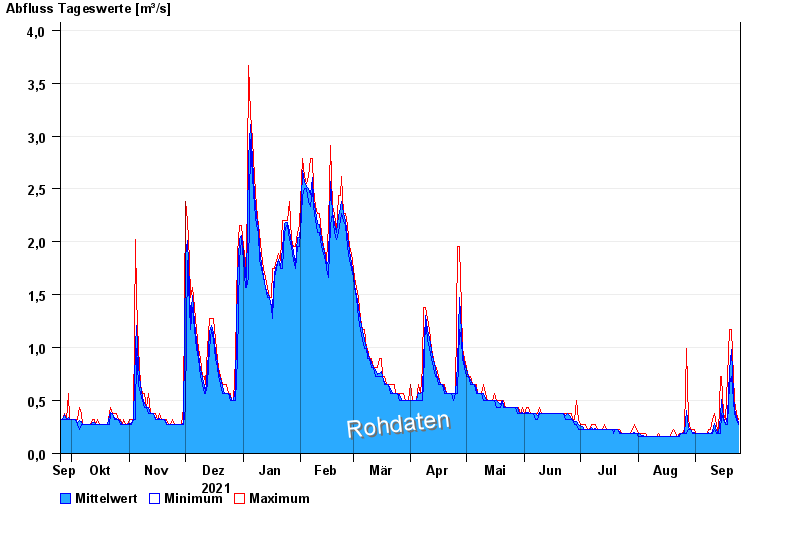
- Chart of year

Chart of year Oberlauter / Lauterbach
Discharge from 25.09.2021 to 24.09.2022
| Date | Mean value [m³/s] | Maximum [m³/s] | Minimum [m³/s] |
|---|---|---|---|
| 24.09.2022 | 0.293 | 0.326 | 0.274 |
| 23.09.2022 | 0.345 | 0.382 | 0.326 |
| 22.09.2022 | 0.418 | 0.498 | 0.382 |
| 21.09.2022 | 0.56 | 0.732 | 0.498 |
| 20.09.2022 | 0.979 | 1.17 | 0.732 |
| 19.09.2022 | 0.789 | 1.17 | 0.651 |
| 18.09.2022 | 0.353 | 0.732 | 0.274 |
© Bayerisches Landesamt für Umwelt 2024