
- Start >
- Rivers >
- Discharge >
- Oberer Main - Elbe >
- Oberlauter >
- Chart of year

Chart of year Oberlauter / Lauterbach
Discharge from 03.06.2021 to 02.06.2022
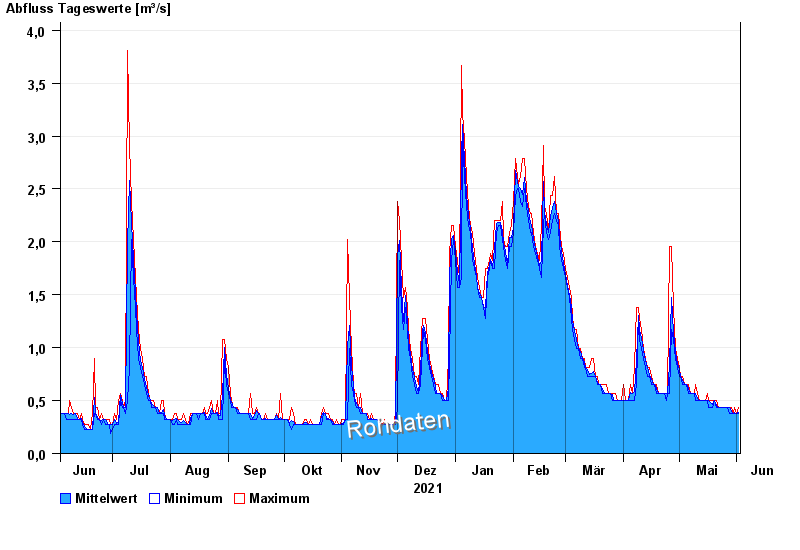
| Date | Mean value [m³/s] | Maximum [m³/s] | Minimum [m³/s] |
|---|---|---|---|
| 02.06.2022 | 0.385 | 0.439 | 0.382 |
| 01.06.2022 | 0.382 | 0.382 | 0.382 |
| 31.05.2022 | 0.383 | 0.439 | 0.382 |
| 30.05.2022 | 0.382 | 0.382 | 0.382 |
| 29.05.2022 | 0.397 | 0.439 | 0.382 |
| 28.05.2022 | 0.436 | 0.439 | 0.382 |
| 27.05.2022 | 0.439 | 0.439 | 0.439 |
© Bayerisches Landesamt für Umwelt 2024