
- Start >
- Rivers >
- Discharge >
- Oberer Main - Elbe >
- Oberlauter >
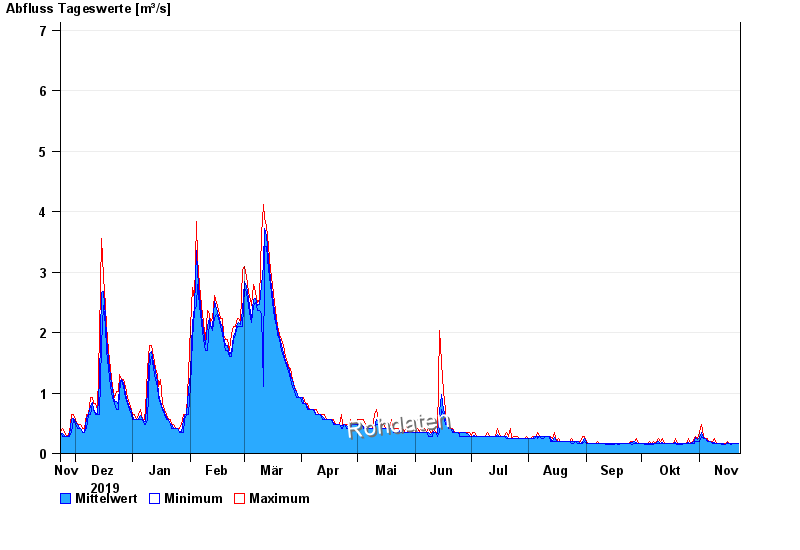
- Chart of year

Chart of year Oberlauter / Lauterbach
Discharge from 23.11.2019 to 22.11.2020
- 02.01.2003 Abfluss: 14,1 m³/s
- 12.02.2005 Abfluss: 13 m³/s
- 06.01.1982 Abfluss: 10,1 m³/s
- 27.01.2002 Abfluss: 9,96 m³/s
- 30.12.1986 Abfluss: 9,89 m³/s
| Date | Mean value [m³/s] | Maximum [m³/s] | Minimum [m³/s] |
|---|---|---|---|
| 22.11.2020 | 0.171 | 0.171 | 0.171 |
| 21.11.2020 | 0.171 | 0.171 | 0.171 |
| 20.11.2020 | 0.171 | 0.171 | 0.171 |
| 19.11.2020 | 0.171 | 0.171 | 0.171 |
| 18.11.2020 | 0.168 | 0.171 | 0.143 |
| 17.11.2020 | 0.171 | 0.171 | 0.171 |
| 16.11.2020 | 0.174 | 0.203 | 0.171 |
© Bayerisches Landesamt für Umwelt 2024