
- Start >
- Rivers >
- Discharge >
- Oberer Main - Elbe >
- Oberlauter >
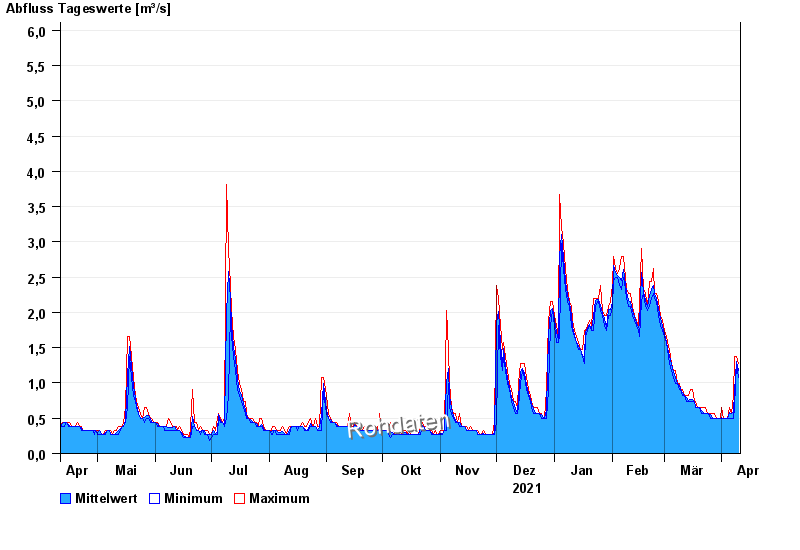
- Chart of year

Chart of year Oberlauter / Lauterbach
Discharge from 11.04.2021 to 10.04.2022
- 02.01.2003 Abfluss: 14,1 m³/s
- 12.02.2005 Abfluss: 13 m³/s
- 06.01.1982 Abfluss: 10,1 m³/s
- 27.01.2002 Abfluss: 9,96 m³/s
- 30.12.1986 Abfluss: 9,89 m³/s
| Date | Mean value [m³/s] | Maximum [m³/s] | Minimum [m³/s] |
|---|---|---|---|
| 10.04.2022 | 1.17 | 1.28 | 1.08 |
| 09.04.2022 | 1.3 | 1.38 | 1.28 |
| 08.04.2022 | 0.877 | 1.38 | 0.651 |
| 07.04.2022 | 0.582 | 0.816 | 0.498 |
| 06.04.2022 | 0.567 | 0.568 | 0.498 |
| 05.04.2022 | 0.575 | 0.651 | 0.498 |
| 04.04.2022 | 0.498 | 0.498 | 0.498 |
© Bayerisches Landesamt für Umwelt 2024