
- Start >
- Rivers >
- Discharge >
- Oberer Main - Elbe >
- Muggendorf >
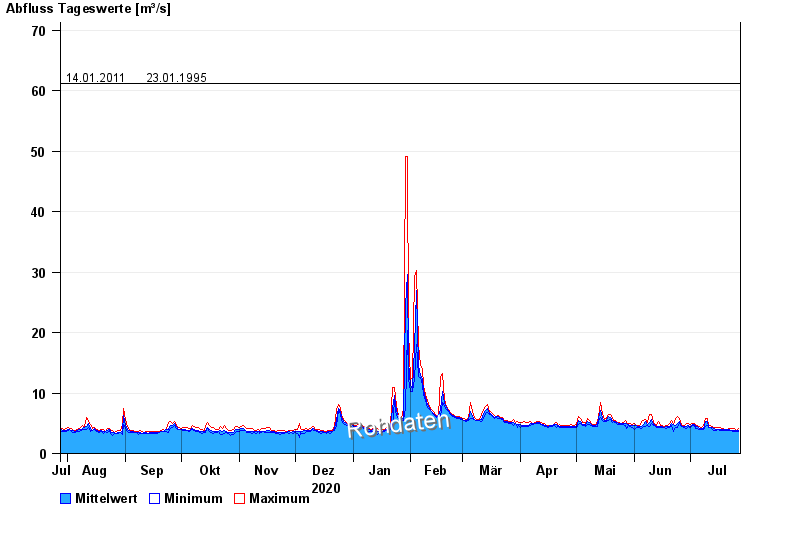
- Chart of year

Chart of year Muggendorf / Wiesent
Discharge from 28.07.2020 to 27.07.2021
- 01.03.1947 Abfluss: 140 m³/s
- 26.01.1995 Abfluss: 111 m³/s
- 01.03.1956 Abfluss: 110 m³/s
- 14.01.2011 Abfluss: 61,2 m³/s
- 23.01.1995 Abfluss: 61,2 m³/s
| Date | Mean value [m³/s] | Maximum [m³/s] | Minimum [m³/s] |
|---|---|---|---|
| 27.07.2021 | 3.85 | 4.09 | 3.7 |
| 26.07.2021 | 3.8 | 3.82 | 3.7 |
| 25.07.2021 | 3.82 | 4.08 | 3.69 |
| 24.07.2021 | 3.86 | 4.08 | 3.69 |
| 23.07.2021 | 3.88 | 4.08 | 3.82 |
| 22.07.2021 | 3.94 | 4.07 | 3.81 |
| 21.07.2021 | 3.92 | 4.05 | 3.78 |
© Bayerisches Landesamt für Umwelt 2024