
- Start >
- Rivers >
- Discharge >
- Oberer Main - Elbe >
- Muggendorf >
- Chart of year

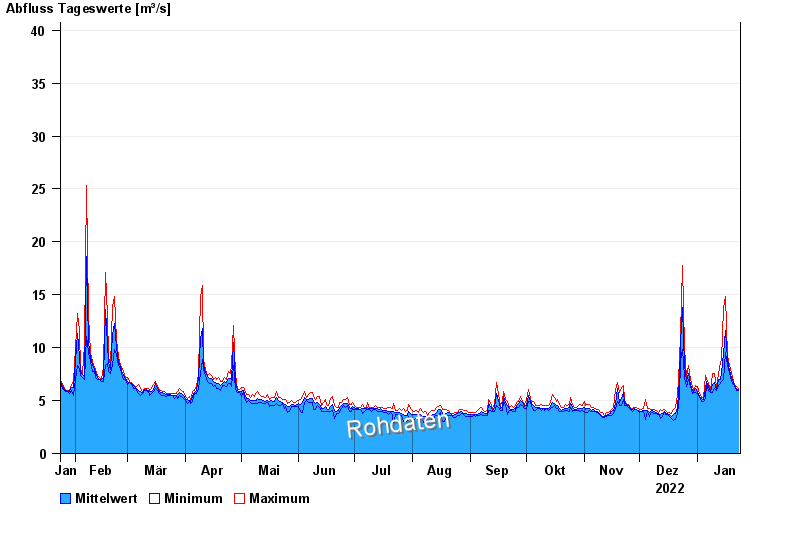
Chart of year Muggendorf / Wiesent
Discharge from 24.01.2022 to 23.01.2023
- 01.03.1947 Abfluss: 140 m³/s
- 26.01.1995 Abfluss: 111 m³/s
- 01.03.1956 Abfluss: 110 m³/s
- 14.01.2011 Abfluss: 61,2 m³/s
- 23.01.1995 Abfluss: 61,2 m³/s
| Date | Mean value [m³/s] | Maximum [m³/s] | Minimum [m³/s] |
|---|---|---|---|
| 23.01.2023 | 6.02 | 6.15 | 5.98 |
| 22.01.2023 | 6.17 | 6.31 | 5.98 |
| 21.01.2023 | 6.39 | 6.48 | 6.31 |
| 20.01.2023 | 6.7 | 6.83 | 6.48 |
| 19.01.2023 | 7.14 | 7.55 | 6.83 |
| 18.01.2023 | 7.83 | 8.31 | 7.55 |
| 17.01.2023 | 8.85 | 9.3 | 8.31 |
© Bayerisches Landesamt für Umwelt 2024