
- Start >
- Rivers >
- Discharge >
- Oberer Main - Elbe >
- Muggendorf >
- Chart of year

Chart of year Muggendorf / Wiesent
Discharge from 21.04.2021 to 20.04.2022
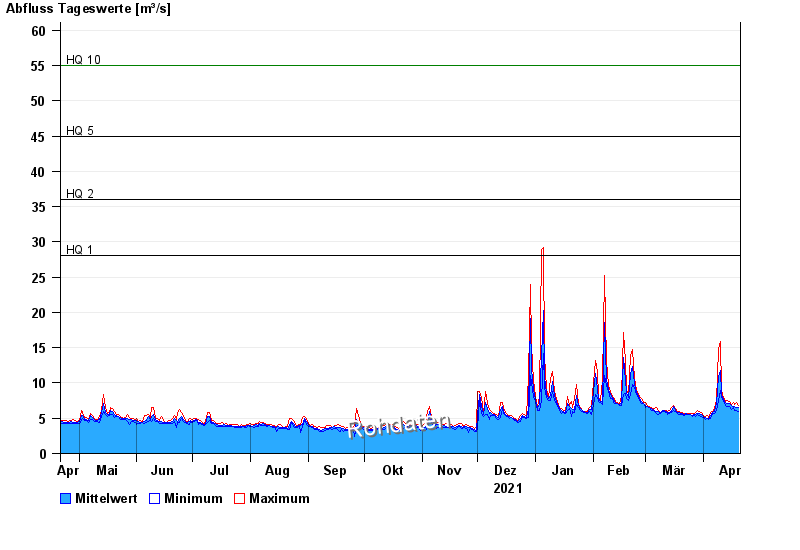
- HQ1 28 m³/s
- HQ2 36 m³/s
- HQ5 45 m³/s
- HQ10 55 m³/s
- HQ20 65 m³/s
- HQ50 80 m³/s
- HQ100 90 m³/s
| Date | Mean value [m³/s] | Maximum [m³/s] | Minimum [m³/s] |
|---|---|---|---|
| 20.04.2022 | 6.47 | 6.82 | 5.95 |
| 19.04.2022 | 6.59 | 7.18 | 6.13 |
| 18.04.2022 | 6.63 | 7 | 6.13 |
| 17.04.2022 | 6.68 | 7.18 | 6.47 |
| 16.04.2022 | 6.78 | 7 | 6.3 |
| 15.04.2022 | 7.08 | 7.36 | 6.65 |
| 14.04.2022 | 7.09 | 7.55 | 6.65 |
© Bayerisches Landesamt für Umwelt 2024