
- Start >
- Rivers >
- Discharge >
- Oberer Main - Elbe >
- Muggendorf >
- Chart of year

Chart of year Muggendorf / Wiesent
Discharge from 31.10.2020 to 30.10.2021
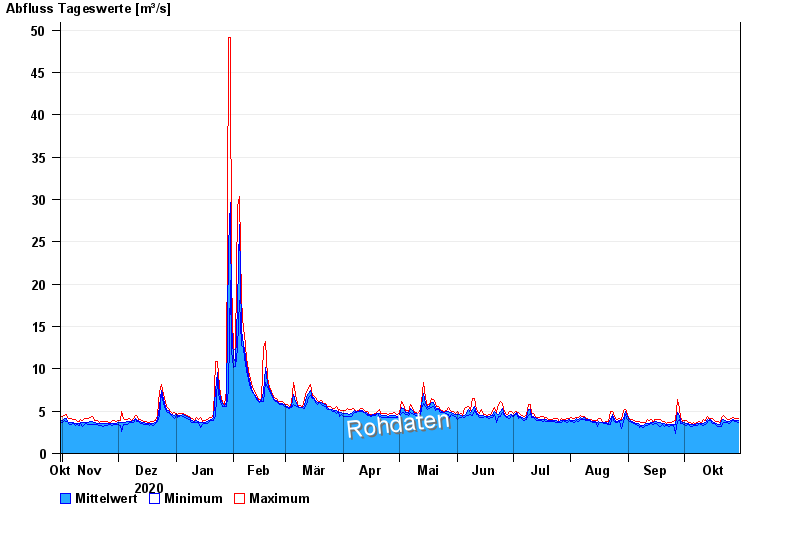
| Date | Mean value [m³/s] | Maximum [m³/s] | Minimum [m³/s] |
|---|---|---|---|
| 30.10.2021 | 3.84 | 4.17 | 3.66 |
| 29.10.2021 | 3.91 | 4.11 | 3.75 |
| 28.10.2021 | 3.95 | 4.19 | 3.81 |
| 27.10.2021 | 3.98 | 4.24 | 3.93 |
| 26.10.2021 | 3.94 | 4.16 | 3.83 |
| 25.10.2021 | 3.81 | 4.04 | 3.6 |
| 24.10.2021 | 3.76 | 4.06 | 3.62 |
© Bayerisches Landesamt für Umwelt 2024