
- Start >
- Rivers >
- Discharge >
- Oberer Main - Elbe >
- Muggendorf >
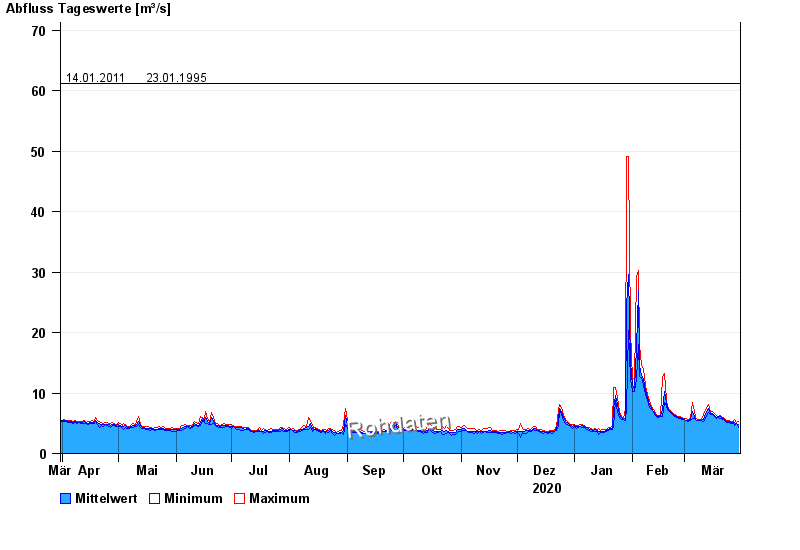
- Chart of year

Chart of year Muggendorf / Wiesent
Discharge from 31.03.2020 to 30.03.2021
- 01.03.1947 Abfluss: 140 m³/s
- 26.01.1995 Abfluss: 111 m³/s
- 01.03.1956 Abfluss: 110 m³/s
- 14.01.2011 Abfluss: 61,2 m³/s
- 23.01.1995 Abfluss: 61,2 m³/s
| Date | Mean value [m³/s] | Maximum [m³/s] | Minimum [m³/s] |
|---|---|---|---|
| 30.03.2021 | 4.87 | 5.25 | 4.37 |
| 29.03.2021 | 4.97 | 5.12 | 4.95 |
| 28.03.2021 | 5.05 | 5.6 | 4.69 |
| 27.03.2021 | 5.11 | 5.31 | 4.99 |
| 26.03.2021 | 5.15 | 5.32 | 5.01 |
| 25.03.2021 | 5.23 | 5.5 | 5.17 |
| 24.03.2021 | 5.37 | 5.52 | 5.19 |
© Bayerisches Landesamt für Umwelt 2024