
- Start >
- Rivers >
- Discharge >
- Oberer Main - Elbe >
- Muggendorf >
- Chart of year

Chart of year Muggendorf / Wiesent
Discharge from 31.03.2021 to 30.03.2022
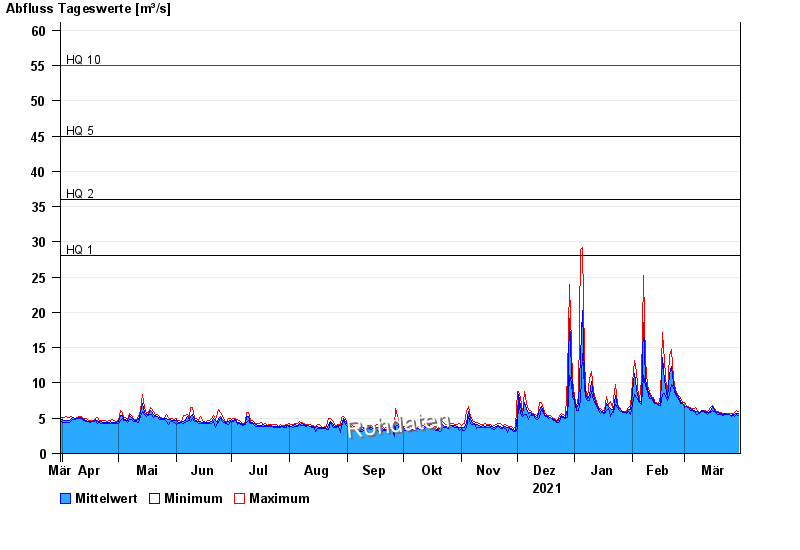
- HQ1 28 m³/s
- HQ2 36 m³/s
- HQ5 45 m³/s
- HQ10 55 m³/s
- HQ20 65 m³/s
- HQ50 80 m³/s
- HQ100 90 m³/s
| Date | Mean value [m³/s] | Maximum [m³/s] | Minimum [m³/s] |
|---|---|---|---|
| 30.03.2022 | 5.7 | 6 | 5.35 |
| 29.03.2022 | 5.73 | 6.16 | 5.51 |
| 28.03.2022 | 5.53 | 5.84 | 5.2 |
| 27.03.2022 | 5.47 | 5.67 | 5.35 |
| 26.03.2022 | 5.45 | 5.67 | 5.2 |
| 25.03.2022 | 5.51 | 5.67 | 5.51 |
| 24.03.2022 | 5.58 | 5.67 | 5.51 |
© Bayerisches Landesamt für Umwelt 2024