
- Start >
- Rivers >
- Discharge >
- Oberer Main - Elbe >
- Muggendorf >
- Chart of year

Chart of year Muggendorf / Wiesent
Discharge from 17.05.2021 to 16.05.2022
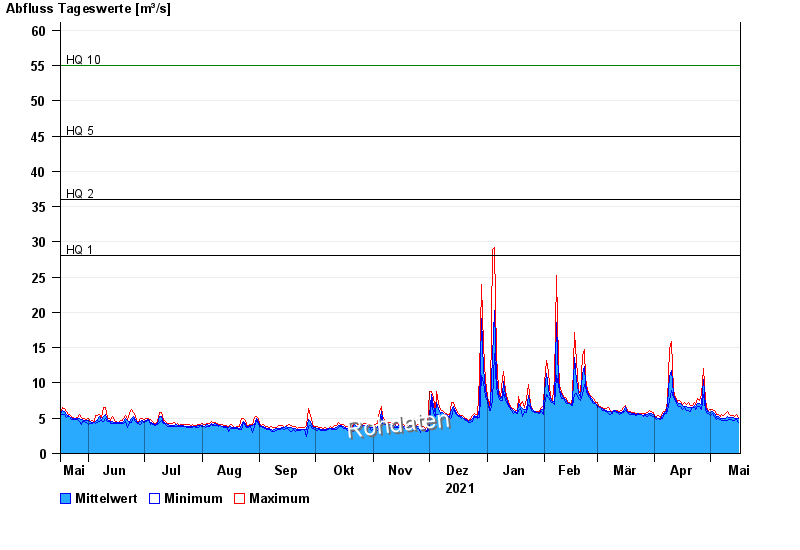
- HQ1 28 m³/s
- HQ2 36 m³/s
- HQ5 45 m³/s
- HQ10 55 m³/s
- HQ20 65 m³/s
- HQ50 80 m³/s
- HQ100 90 m³/s
| Date | Mean value [m³/s] | Maximum [m³/s] | Minimum [m³/s] |
|---|---|---|---|
| 16.05.2022 | 4.96 | 5.12 | 4.4 |
| 15.05.2022 | 5.01 | 5.58 | 4.82 |
| 14.05.2022 | 4.96 | 5.27 | 4.68 |
| 13.05.2022 | 5.05 | 5.42 | 4.68 |
| 12.05.2022 | 5.07 | 5.42 | 4.82 |
| 11.05.2022 | 5.15 | 5.58 | 4.82 |
| 10.05.2022 | 5.21 | 5.89 | 4.68 |
© Bayerisches Landesamt für Umwelt 2024