
- Start >
- Rivers >
- Discharge >
- Oberer Main - Elbe >
- Muggendorf >
- Chart of year

Chart of year Muggendorf / Wiesent
Discharge from 17.05.2020 to 16.05.2021
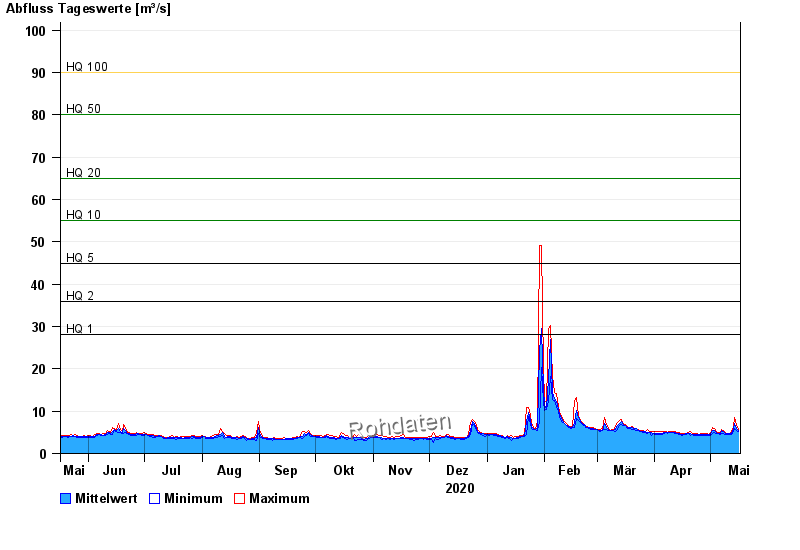
- HQ1 28 m³/s
- HQ2 36 m³/s
- HQ5 45 m³/s
- HQ10 55 m³/s
- HQ20 65 m³/s
- HQ50 80 m³/s
- HQ100 90 m³/s
| Date | Mean value [m³/s] | Maximum [m³/s] | Minimum [m³/s] |
|---|---|---|---|
| 16.05.2021 | 5.46 | 5.67 | 5.21 |
| 15.05.2021 | 5.85 | 6.54 | 5.53 |
| 14.05.2021 | 7.04 | 8.42 | 5.89 |
| 13.05.2021 | 5.84 | 6.08 | 5.29 |
| 12.05.2021 | 4.82 | 5.3 | 4.44 |
| 11.05.2021 | 4.62 | 4.77 | 4.47 |
| 10.05.2021 | 4.67 | 4.82 | 4.53 |
© Bayerisches Landesamt für Umwelt 2024