
- Start >
- Rivers >
- Discharge >
- Oberer Main - Elbe >
- Muggendorf >
- Chart of year

Chart of year Muggendorf / Wiesent
Discharge from 15.08.2020 to 14.08.2021
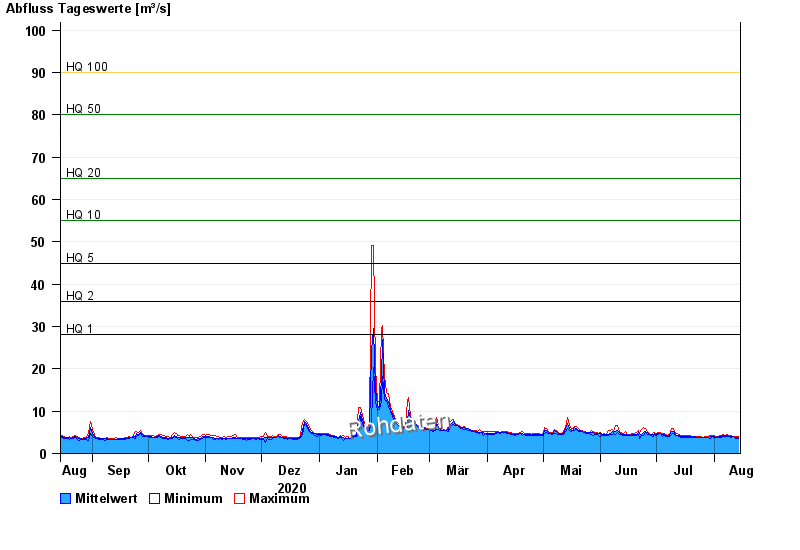
- HQ1 28 m³/s
- HQ2 36 m³/s
- HQ5 45 m³/s
- HQ10 55 m³/s
- HQ20 65 m³/s
- HQ50 80 m³/s
- HQ100 90 m³/s
| Date | Mean value [m³/s] | Maximum [m³/s] | Minimum [m³/s] |
|---|---|---|---|
| 14.08.2021 | 3.76 | 3.9 | 3.64 |
| 13.08.2021 | 3.77 | 3.91 | 3.66 |
| 12.08.2021 | 3.83 | 4.06 | 3.79 |
| 11.08.2021 | 3.99 | 4.07 | 3.91 |
| 10.08.2021 | 3.99 | 4.16 | 3.85 |
| 09.08.2021 | 4.06 | 4.22 | 3.91 |
| 08.08.2021 | 4.2 | 4.38 | 3.97 |
© Bayerisches Landesamt für Umwelt 2024