
- Start >
- Rivers >
- Discharge >
- Oberer Main - Elbe >
- Michelfeld >
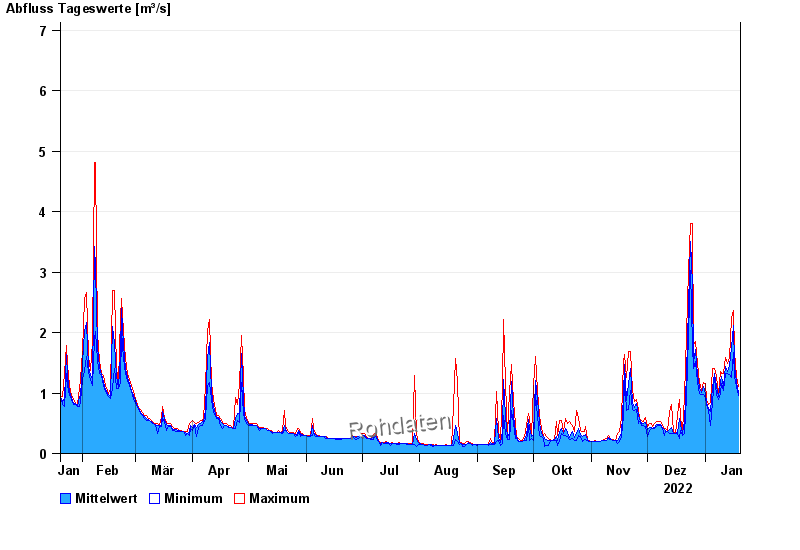
- Chart of year

Chart of year Michelfeld / Pegnitz
Discharge from 20.01.2022 to 19.01.2023
- 09.01.2011 Abfluss: 20,3 m³/s
- 14.01.2011 Abfluss: 19,2 m³/s
- 17.12.2011 Abfluss: 14,6 m³/s
- 10.12.2010 Abfluss: 10,5 m³/s
- 06.01.2012 Abfluss: 10,1 m³/s
| Date | Mean value [m³/s] | Maximum [m³/s] | Minimum [m³/s] |
|---|---|---|---|
| 19.01.2023 | 1.01 | 1.1 | 0.951 |
| 18.01.2023 | 1.18 | 1.28 | 1.1 |
| 17.01.2023 | 1.45 | 1.67 | 1.28 |
| 16.01.2023 | 2.11 | 2.36 | 1.67 |
| 15.01.2023 | 1.75 | 2.24 | 1.25 |
| 14.01.2023 | 1.46 | 1.58 | 1.3 |
| 13.01.2023 | 1.35 | 1.49 | 1.32 |
© Bayerisches Landesamt für Umwelt 2024