
- Start >
- Rivers >
- Discharge >
- Oberer Main - Elbe >
- Mauthaus >
- Chart of total period

Chart of total period Mauthaus / Nordhalbener Ködel
Discharge from 01.11.1965 to 20.04.2024
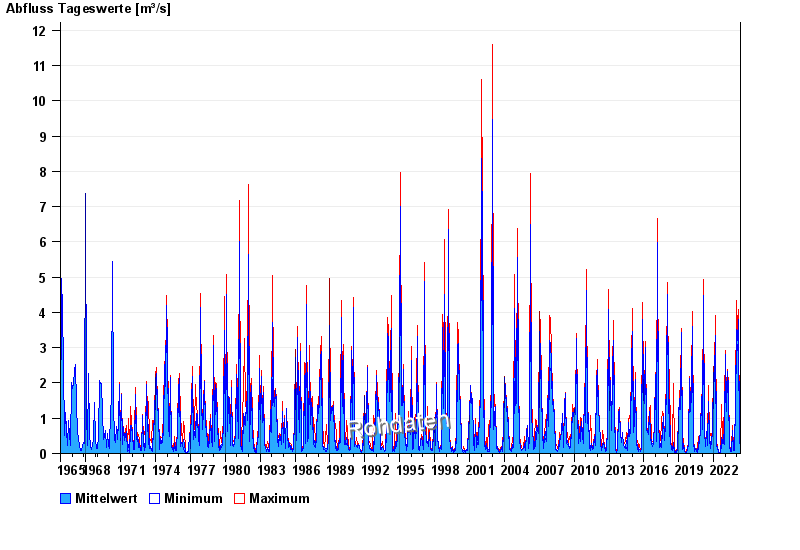
| Date | Mean value [m³/s] | Maximum [m³/s] | Minimum [m³/s] |
|---|---|---|---|
| 20.04.2024 | 0.296 | 0.332 | 0.293 |
| 19.04.2024 | 0.243 | 0.293 | 0.184 |
| 18.04.2024 | 0.218 | 0.218 | 0.218 |
| 17.04.2024 | 0.254 | 0.293 | 0.218 |
| 16.04.2024 | 0.235 | 0.332 | 0.184 |
| 15.04.2024 | 0.184 | 0.184 | 0.184 |
| 14.04.2024 | 0.195 | 0.218 | 0.184 |
© Bayerisches Landesamt für Umwelt 2024