
- Start >
- Rivers >
- Discharge >
- Oberer Main - Elbe >
- Marktredwitz >
- Chart of total period

Chart of total period Marktredwitz / Kössein
Discharge from 01.11.1970 to 26.04.2024
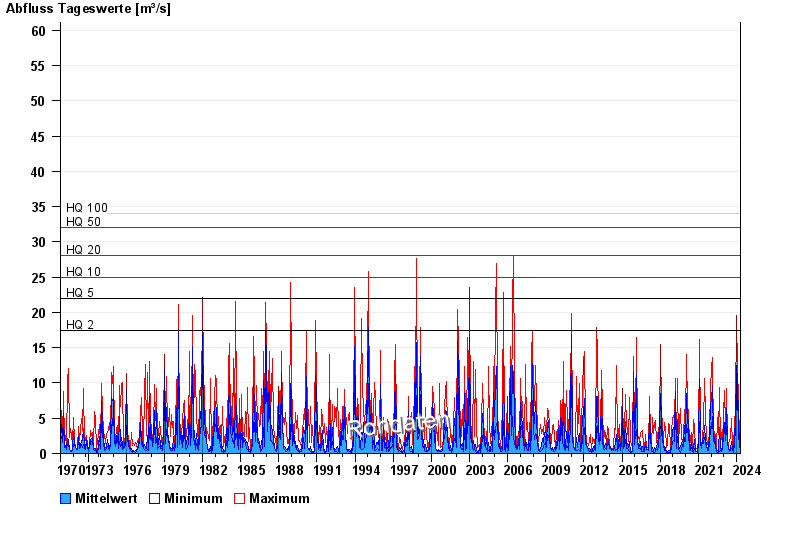
- HQ2 17,5 m³/s
- HQ5 22 m³/s
- HQ10 25 m³/s
- HQ20 28 m³/s
- HQ50 32 m³/s
- HQ100 34 m³/s
| Date | Mean value [m³/s] | Maximum [m³/s] | Minimum [m³/s] |
|---|---|---|---|
| 26.04.2024 | 1.24 | 1.24 | 1.24 |
| 25.04.2024 | 1.11 | 1.3 | 1.01 |
| 24.04.2024 | 1.1 | 1.3 | 1.01 |
| 23.04.2024 | 1.32 | 1.76 | 1.12 |
| 22.04.2024 | 1.44 | 1.97 | 1.18 |
| 21.04.2024 | 1.32 | 1.76 | 1.07 |
| 20.04.2024 | 1.43 | 1.62 | 1.12 |
© Bayerisches Landesamt für Umwelt 2024