
- Start >
- Rivers >
- Discharge >
- Oberer Main - Elbe >
- Marktleuthen >
- Chart of total period

Chart of total period Marktleuthen / Eger
Discharge from 01.11.1936 to 25.04.2024
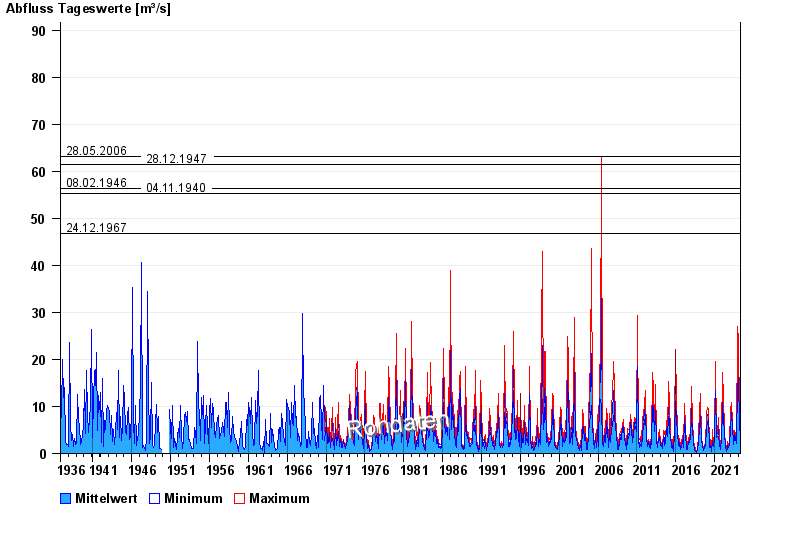
- 28.05.2006 Abfluss: 63,2 m³/s
- 28.12.1947 Abfluss: 61,4 m³/s
- 08.02.1946 Abfluss: 56,4 m³/s
- 04.11.1940 Abfluss: 55,2 m³/s
- 24.12.1967 Abfluss: 46,7 m³/s
| Date | Mean value [m³/s] | Maximum [m³/s] | Minimum [m³/s] |
|---|---|---|---|
| 25.04.2024 | 1.85 | 1.91 | 1.76 |
| 24.04.2024 | 2.05 | 2.23 | 1.91 |
| 23.04.2024 | 2.41 | 2.74 | 1.84 |
| 22.04.2024 | 2.67 | 2.92 | 2.4 |
| 21.04.2024 | 2.8 | 3.1 | 2.23 |
| 20.04.2024 | 2.24 | 2.65 | 1.54 |
| 19.04.2024 | 1.23 | 1.54 | 1.1 |
© Bayerisches Landesamt für Umwelt 2024