
- Start >
- Rivers >
- Discharge >
- Oberer Main - Elbe >
- Marktleuthen >
- Chart of total period

Chart of total period Marktleuthen / Eger
Discharge from 01.11.1936 to 24.04.2024
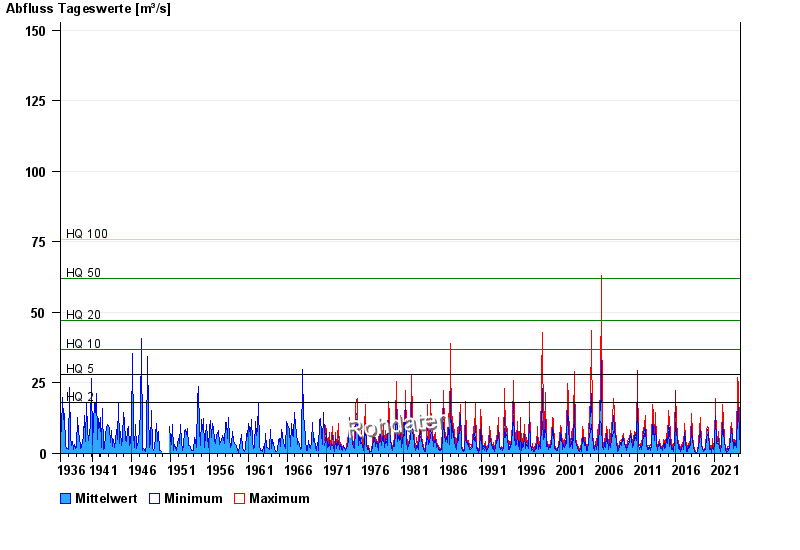
- HQ2 18 m³/s
- HQ5 28 m³/s
- HQ10 37 m³/s
- HQ20 47 m³/s
- HQ50 62 m³/s
- HQ100 76 m³/s
| Date | Mean value [m³/s] | Maximum [m³/s] | Minimum [m³/s] |
|---|---|---|---|
| 24.04.2024 | 2.16 | 2.23 | 2.15 |
| 23.04.2024 | 2.41 | 2.74 | 1.84 |
| 22.04.2024 | 2.67 | 2.92 | 2.4 |
| 21.04.2024 | 2.8 | 3.1 | 2.23 |
| 20.04.2024 | 2.24 | 2.65 | 1.54 |
| 19.04.2024 | 1.23 | 1.54 | 1.1 |
| 18.04.2024 | 1.27 | 1.41 | 1.22 |
© Bayerisches Landesamt für Umwelt 2024