
- Start >
- Rivers >
- Discharge >
- Oberer Main - Elbe >
- Mainleus >
- Chart of total period

Chart of total period Mainleus / Main
Discharge from 01.11.1982 to 25.04.2024
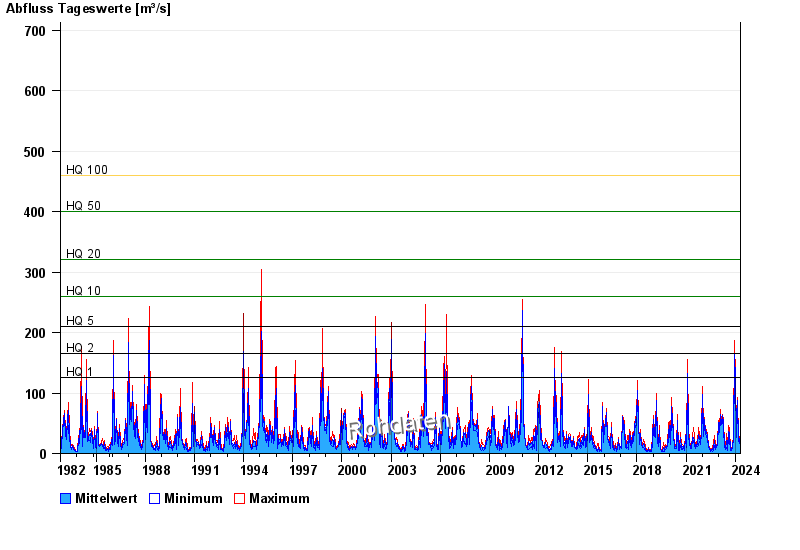
- HQ1 125 m³/s
- HQ2 165 m³/s
- HQ5 210 m³/s
- HQ10 260 m³/s
- HQ20 320 m³/s
- HQ50 400 m³/s
- HQ100 460 m³/s
| Date | Mean value [m³/s] | Maximum [m³/s] | Minimum [m³/s] |
|---|---|---|---|
| 25.04.2024 | 16.2 | 17.2 | 15.5 |
| 24.04.2024 | 17.2 | 18.4 | 16.7 |
| 23.04.2024 | 21.5 | 25.6 | 18.4 |
| 22.04.2024 | 31.9 | 34.7 | 25.6 |
| 21.04.2024 | 26.2 | 32.3 | 23.3 |
| 20.04.2024 | 22.7 | 24.7 | 17.5 |
| 19.04.2024 | 11.5 | 17.2 | 10.1 |
© Bayerisches Landesamt für Umwelt 2024