
- Start >
- Rivers >
- Discharge >
- Oberer Main - Elbe >
- Lohr >
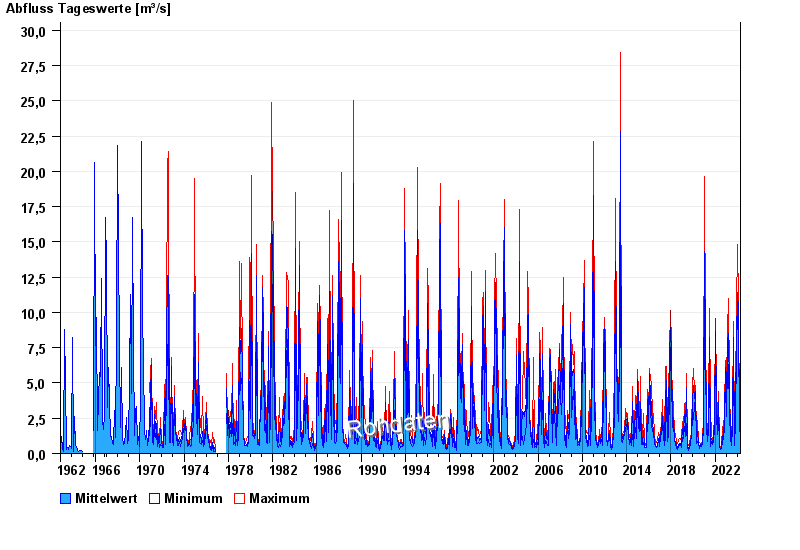
- Chart of total period

Chart of total period Lohr / Baunach
Discharge from 01.11.1962 to 19.04.2024
| Date | Mean value [m³/s] | Maximum [m³/s] | Minimum [m³/s] |
|---|---|---|---|
| 19.04.2024 | 0.748 | 0.748 | 0.748 |
| 18.04.2024 | 0.786 | 0.798 | 0.748 |
| 17.04.2024 | 0.859 | 0.9 | 0.798 |
| 16.04.2024 | 0.767 | 0.9 | 0.699 |
| 15.04.2024 | 0.685 | 0.774 | 0.675 |
| 14.04.2024 | 0.705 | 0.748 | 0.65 |
| 13.04.2024 | 0.699 | 0.699 | 0.699 |
© Bayerisches Landesamt für Umwelt 2024